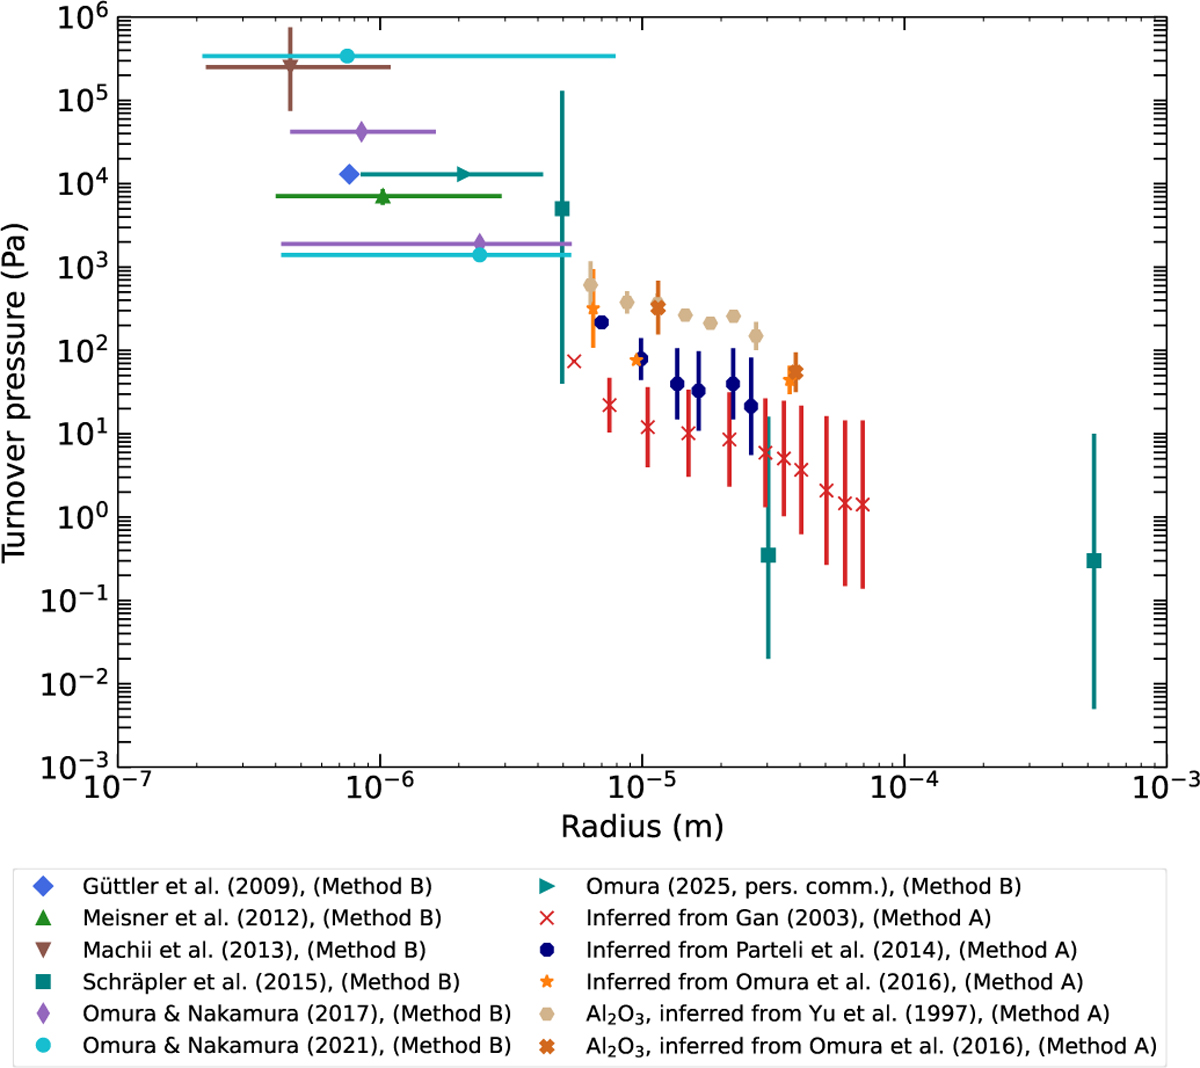
Fig. 3
Download original image
Obtained values of the turnover pressure, pm, as a function of grain radius, r, as listed in Table 1. It should be noted that we used transition widths in the range ∆ = 0.1... 1.3 for all data points analysed using Method A so that the relatively large range of the derived pm values is not an error range but denotes the range of the formal results. Most of the values obtained refer to silica samples. For comparison, the turnover pressures inferred from the Al2O3 samples are illustrated as well.
Current usage metrics show cumulative count of Article Views (full-text article views including HTML views, PDF and ePub downloads, according to the available data) and Abstracts Views on Vision4Press platform.
Data correspond to usage on the plateform after 2015. The current usage metrics is available 48-96 hours after online publication and is updated daily on week days.
Initial download of the metrics may take a while.