Fig. 4
Download original image
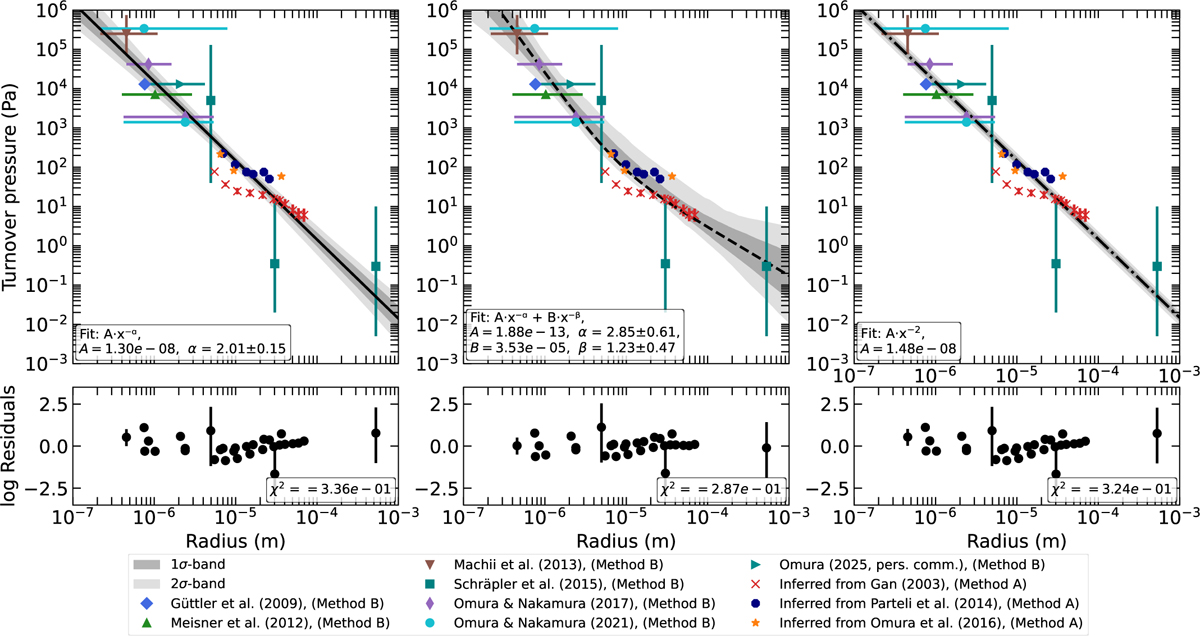
Result of the fitting procedure of the turnover pressure, pm, as a function of grain radius, r, for all SiO2 samples using Eq. (17) (left, solid line), Eq. (18) (centre, dashed curve), and Eq. (20) (right, dash-dotted line), respectively. The fits were performed using the least-squares method and ignoring individual error bars. The turnover pressure values obtained by Method A were restricted by the condition ∆ = 0.4...0.6. The logarithmic residuals are illustrated in the lower panels, together with the individual ranges in pm (Method A) or error bars (Method B) of the data points. The fit results are noted in the respective legend. The shaded regions illustrate the 1σ and 2σ uncertainties of the respective fits.
Current usage metrics show cumulative count of Article Views (full-text article views including HTML views, PDF and ePub downloads, according to the available data) and Abstracts Views on Vision4Press platform.
Data correspond to usage on the plateform after 2015. The current usage metrics is available 48-96 hours after online publication and is updated daily on week days.
Initial download of the metrics may take a while.