Fig. 5
Download original image
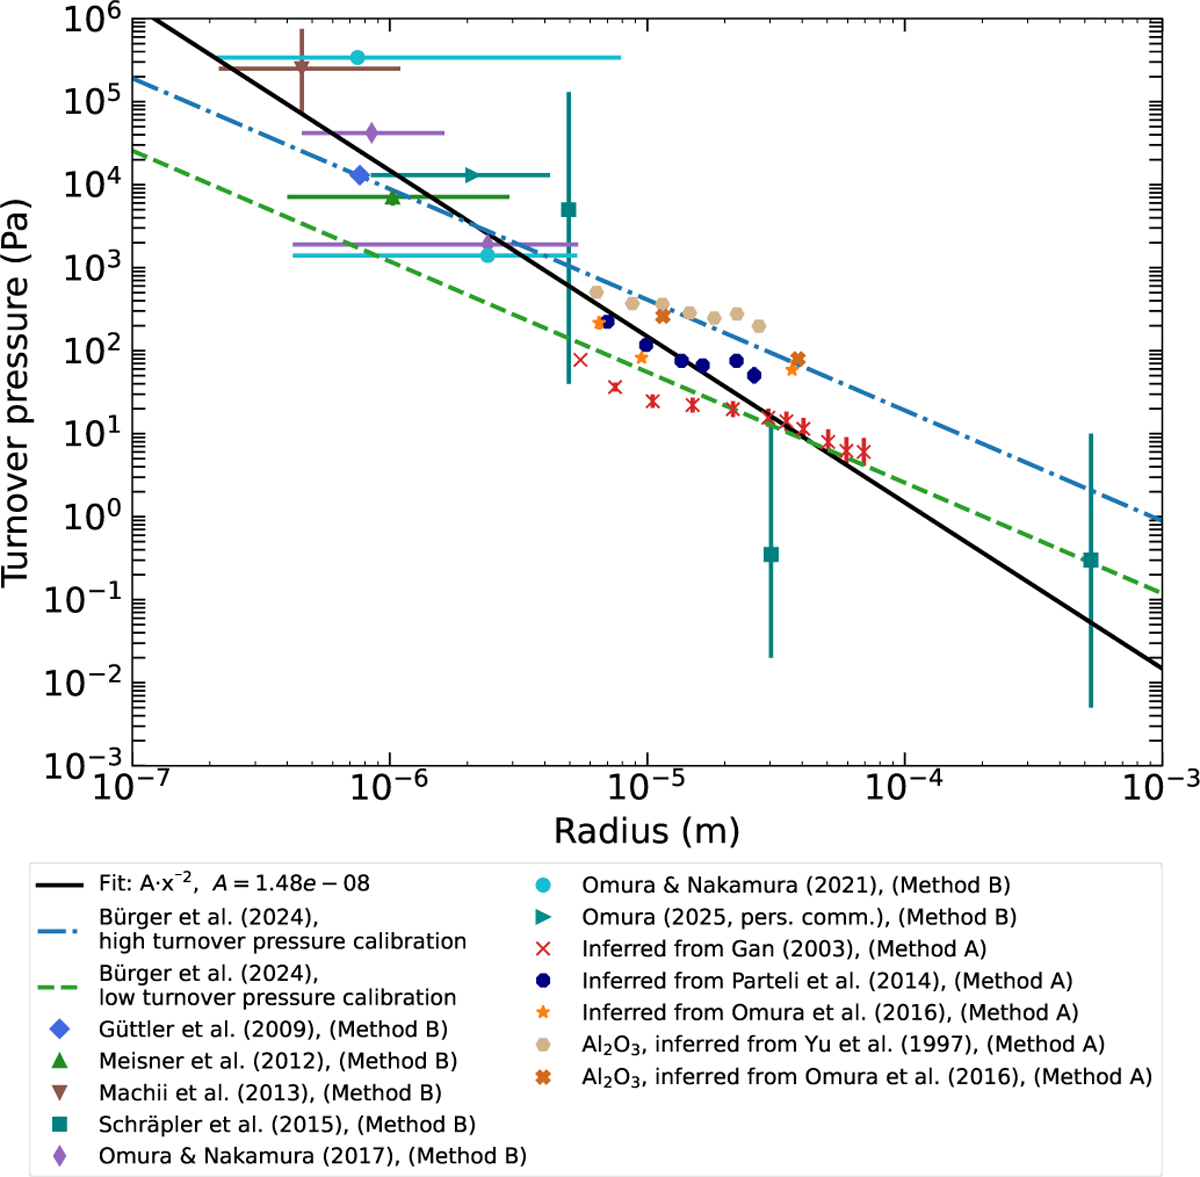
Comparison between the turnover pressure-grain size relations used by Bürger et al. (2024) (dashed and dash-dotted lines) and the main result of this work (Eq. (20), solid line). In addition to the data obtained for SiO2, the turnover pressure inferred from the Al2O3 samples are illustrated as well but were not used for fitting. It should be noted that we only used transition widths in the range ∆ = 0.4...0.6 for all data points analysed using Method A.
Current usage metrics show cumulative count of Article Views (full-text article views including HTML views, PDF and ePub downloads, according to the available data) and Abstracts Views on Vision4Press platform.
Data correspond to usage on the plateform after 2015. The current usage metrics is available 48-96 hours after online publication and is updated daily on week days.
Initial download of the metrics may take a while.