Fig. 1
Download original image
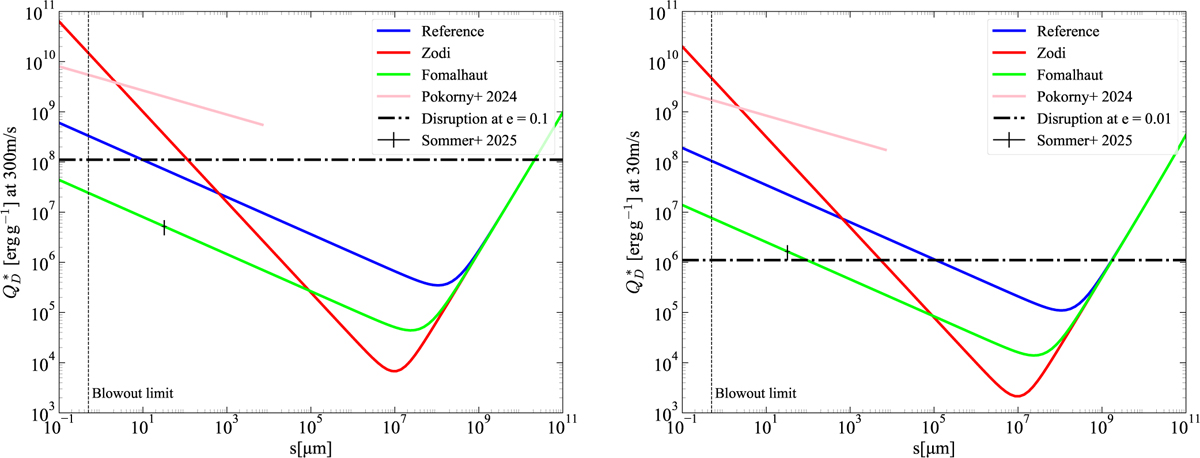
Chosen ![]() models: Reference (blue), Zodi (red), and Fomalhaut (green). These are shown for two typical collisional velocities: 300 m s−1 (left) and 30 m s−1 (right). For comparison, the
models: Reference (blue), Zodi (red), and Fomalhaut (green). These are shown for two typical collisional velocities: 300 m s−1 (left) and 30 m s−1 (right). For comparison, the ![]() fit from Pokorny et al. (2024) (pink) as well as the Sommer et al. (2025) constraint at 32 µm (black dot with the uncertainty bar) are plotted as well. Horizontal black lines mark an approximate disruption threshold, for the respective velocities. Note that the Pokorny et al. (2024) model only describes particles with sizes up to 1 cm.
fit from Pokorny et al. (2024) (pink) as well as the Sommer et al. (2025) constraint at 32 µm (black dot with the uncertainty bar) are plotted as well. Horizontal black lines mark an approximate disruption threshold, for the respective velocities. Note that the Pokorny et al. (2024) model only describes particles with sizes up to 1 cm.
Current usage metrics show cumulative count of Article Views (full-text article views including HTML views, PDF and ePub downloads, according to the available data) and Abstracts Views on Vision4Press platform.
Data correspond to usage on the plateform after 2015. The current usage metrics is available 48-96 hours after online publication and is updated daily on week days.
Initial download of the metrics may take a while.