Open Access
Fig. 10
Download original image
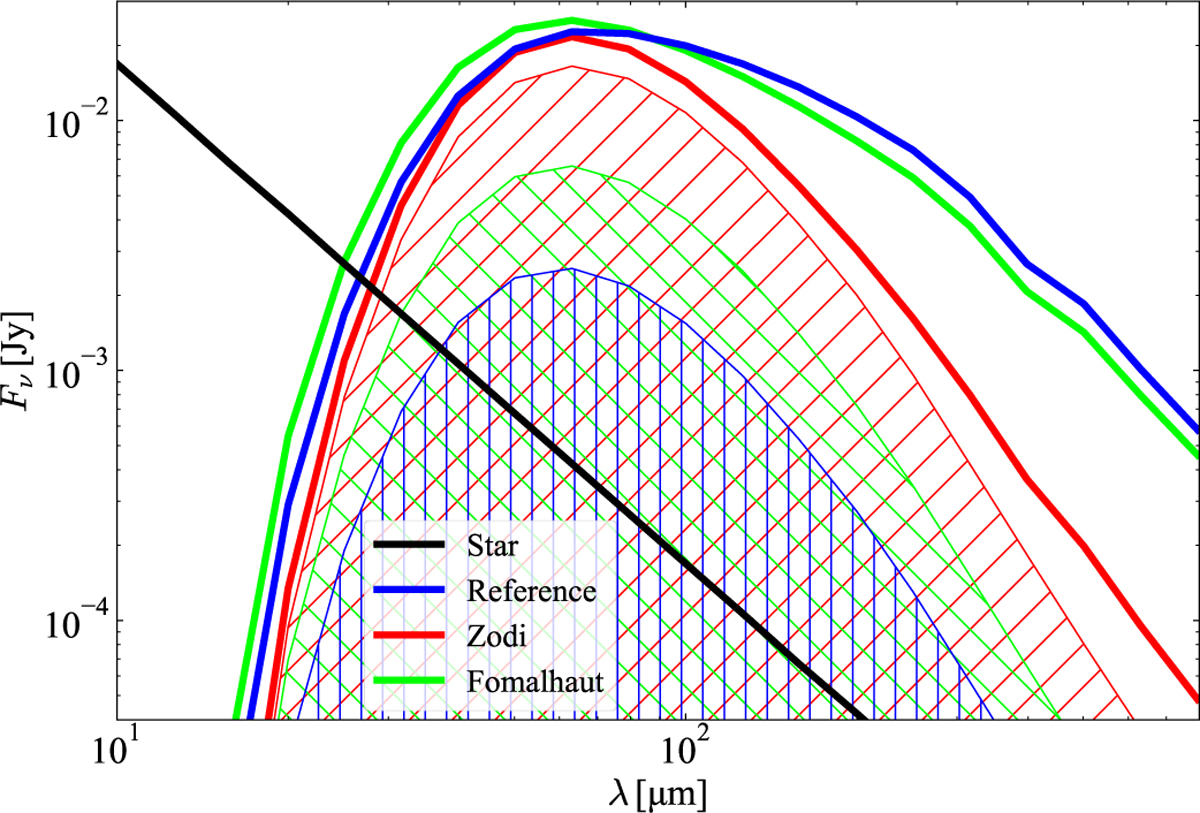
Thermal emission SEDs in the three runs analyzed (colored lines). The hatched regions indicate the portion of the SEDs generated by the part of the disk outside of 150 au. The black line is the stellar photosphere.
Current usage metrics show cumulative count of Article Views (full-text article views including HTML views, PDF and ePub downloads, according to the available data) and Abstracts Views on Vision4Press platform.
Data correspond to usage on the plateform after 2015. The current usage metrics is available 48-96 hours after online publication and is updated daily on week days.
Initial download of the metrics may take a while.