Open Access
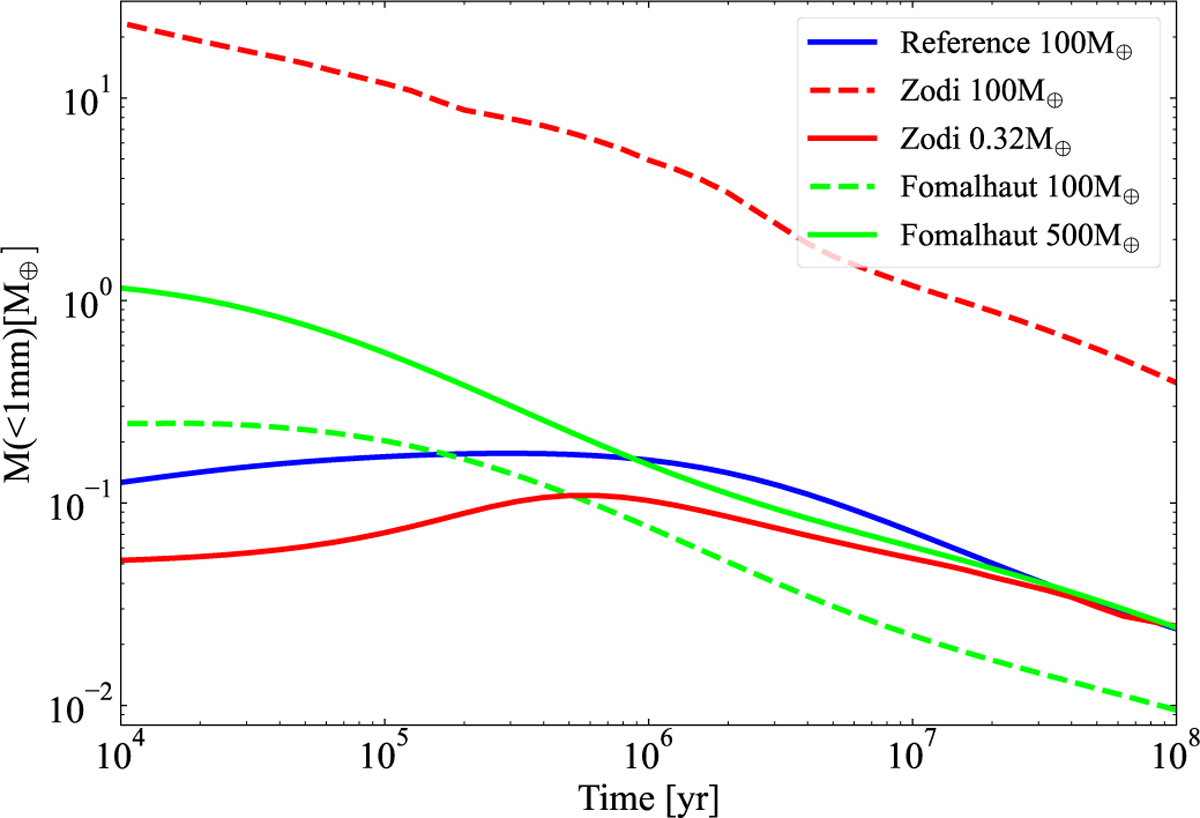
Fig. 3
Download original image
Dust mass evolution for the three runs. Dashed lines depict the original (unscaled) and solid lines the scaled versions of the runs. Only one curve is shown for the Reference run as the scaled and unscaled versions are equivalent here.
Current usage metrics show cumulative count of Article Views (full-text article views including HTML views, PDF and ePub downloads, according to the available data) and Abstracts Views on Vision4Press platform.
Data correspond to usage on the plateform after 2015. The current usage metrics is available 48-96 hours after online publication and is updated daily on week days.
Initial download of the metrics may take a while.