Open Access
Fig. 1.
Download original image
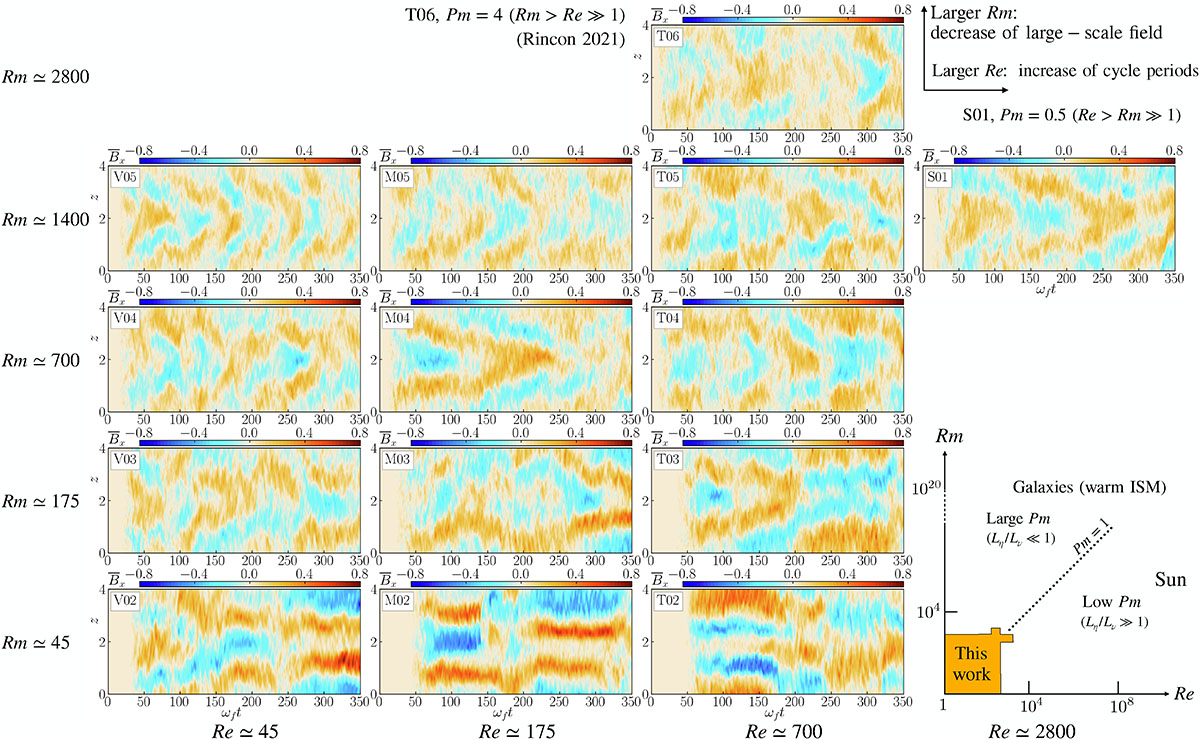
Butterfly diagrams ![]() of large-scale non-linear helical dynamo modes vs Re and Rm. Run S01 (Pm = 0.5) is the rightmost plot; run T06 (Pm = 4) of R21 is the topmost plot. The parameter range spanned is shown at the bottom right. The same colour scale is used in all plots.
of large-scale non-linear helical dynamo modes vs Re and Rm. Run S01 (Pm = 0.5) is the rightmost plot; run T06 (Pm = 4) of R21 is the topmost plot. The parameter range spanned is shown at the bottom right. The same colour scale is used in all plots.
Current usage metrics show cumulative count of Article Views (full-text article views including HTML views, PDF and ePub downloads, according to the available data) and Abstracts Views on Vision4Press platform.
Data correspond to usage on the plateform after 2015. The current usage metrics is available 48-96 hours after online publication and is updated daily on week days.
Initial download of the metrics may take a while.