Open Access
Fig. A.1
Download original image
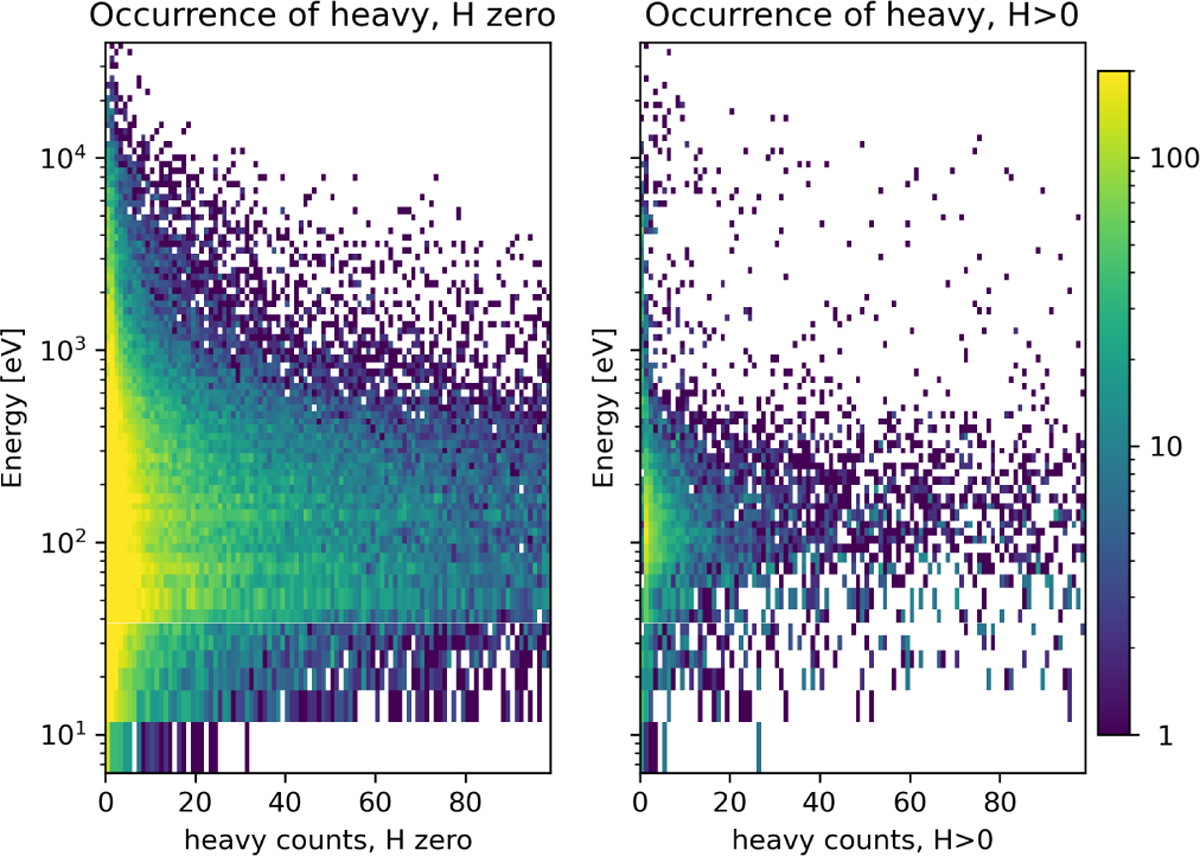
Occurrence (colour scale) of heavy ion counts (x axis) at different energies (y-axis). Left: Data when no signal was detected in the H+ mass channels at the same energy and for the same directional anode (sector). Right: Same but when the H+ signal was greater than zero.
Current usage metrics show cumulative count of Article Views (full-text article views including HTML views, PDF and ePub downloads, according to the available data) and Abstracts Views on Vision4Press platform.
Data correspond to usage on the plateform after 2015. The current usage metrics is available 48-96 hours after online publication and is updated daily on week days.
Initial download of the metrics may take a while.