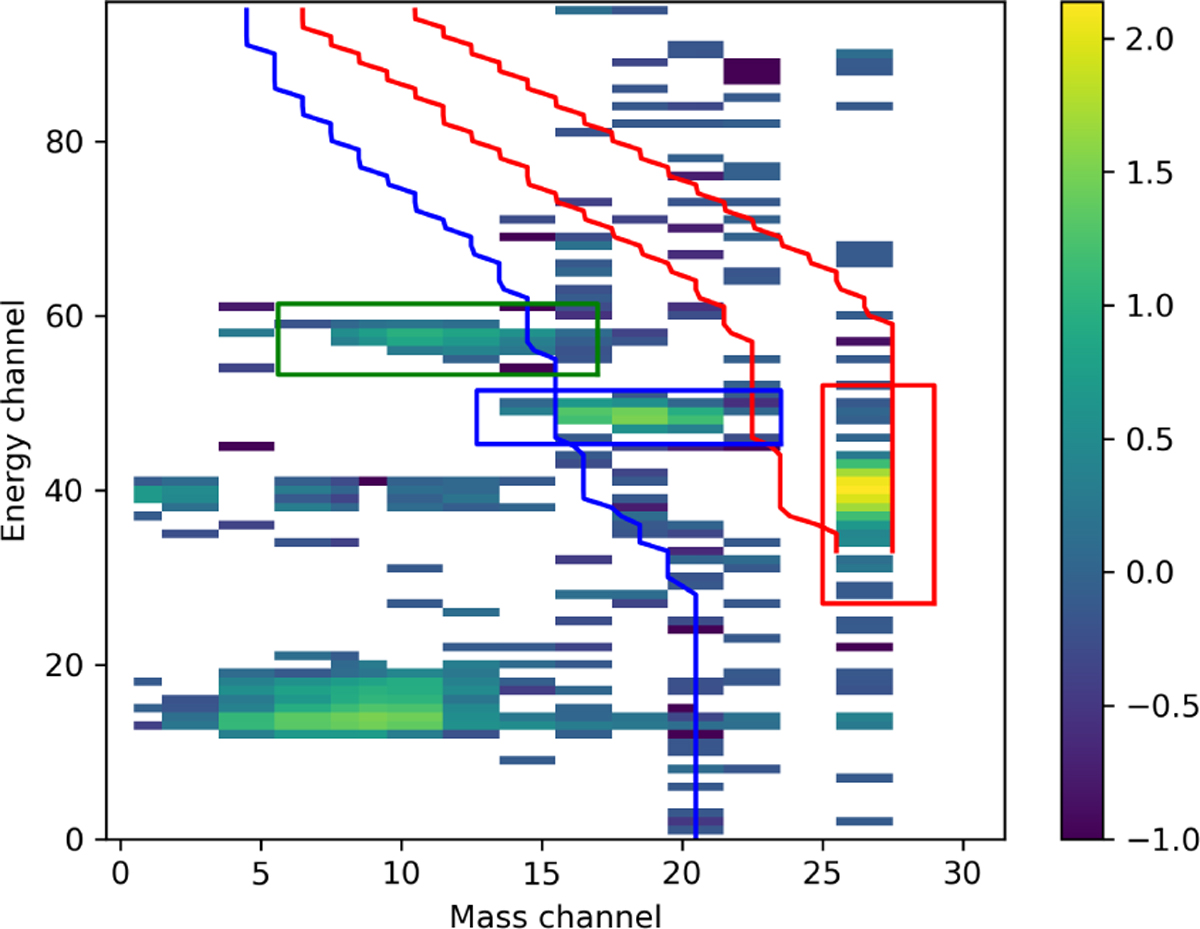
Fig. 2
Download original image
Screenshot from energy-mass channel-selection script. The user draws a box and identifies the ion species for any significant signal. Selected data are shown with a red box for H+, a blue box for He2+, and a green box for He+. Two red lines delineate the expected position of the H+ signal; a blue line shows the border between He2+ and He+. The colour-scale shows the logarithm of the number of counts. The shown signal is summed over all directions.
Current usage metrics show cumulative count of Article Views (full-text article views including HTML views, PDF and ePub downloads, according to the available data) and Abstracts Views on Vision4Press platform.
Data correspond to usage on the plateform after 2015. The current usage metrics is available 48-96 hours after online publication and is updated daily on week days.
Initial download of the metrics may take a while.