Fig. 3
Download original image
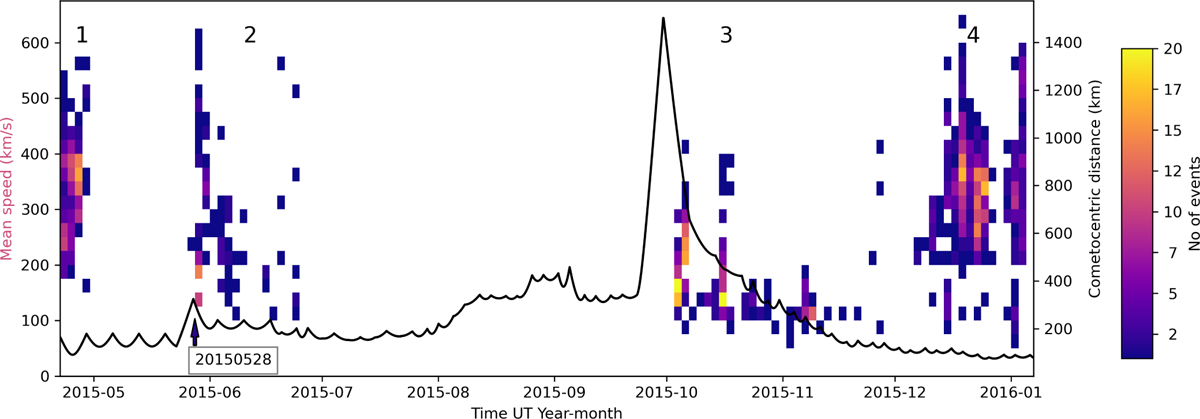
Cometocentric distance of Rosetta (km) as function of time is shown with a black line (right y-axis). The mean speed of the observed solar wind protons (km/s on the right y-axis) is shown with occurrence in time-velocity bins using a colour-scale. The four periods discussed in the text are marked with numbers in the top of the plot. The beginning of the data, from 28 May 2015, is marked with an arrow.
Current usage metrics show cumulative count of Article Views (full-text article views including HTML views, PDF and ePub downloads, according to the available data) and Abstracts Views on Vision4Press platform.
Data correspond to usage on the plateform after 2015. The current usage metrics is available 48-96 hours after online publication and is updated daily on week days.
Initial download of the metrics may take a while.