Fig. 4
Download original image
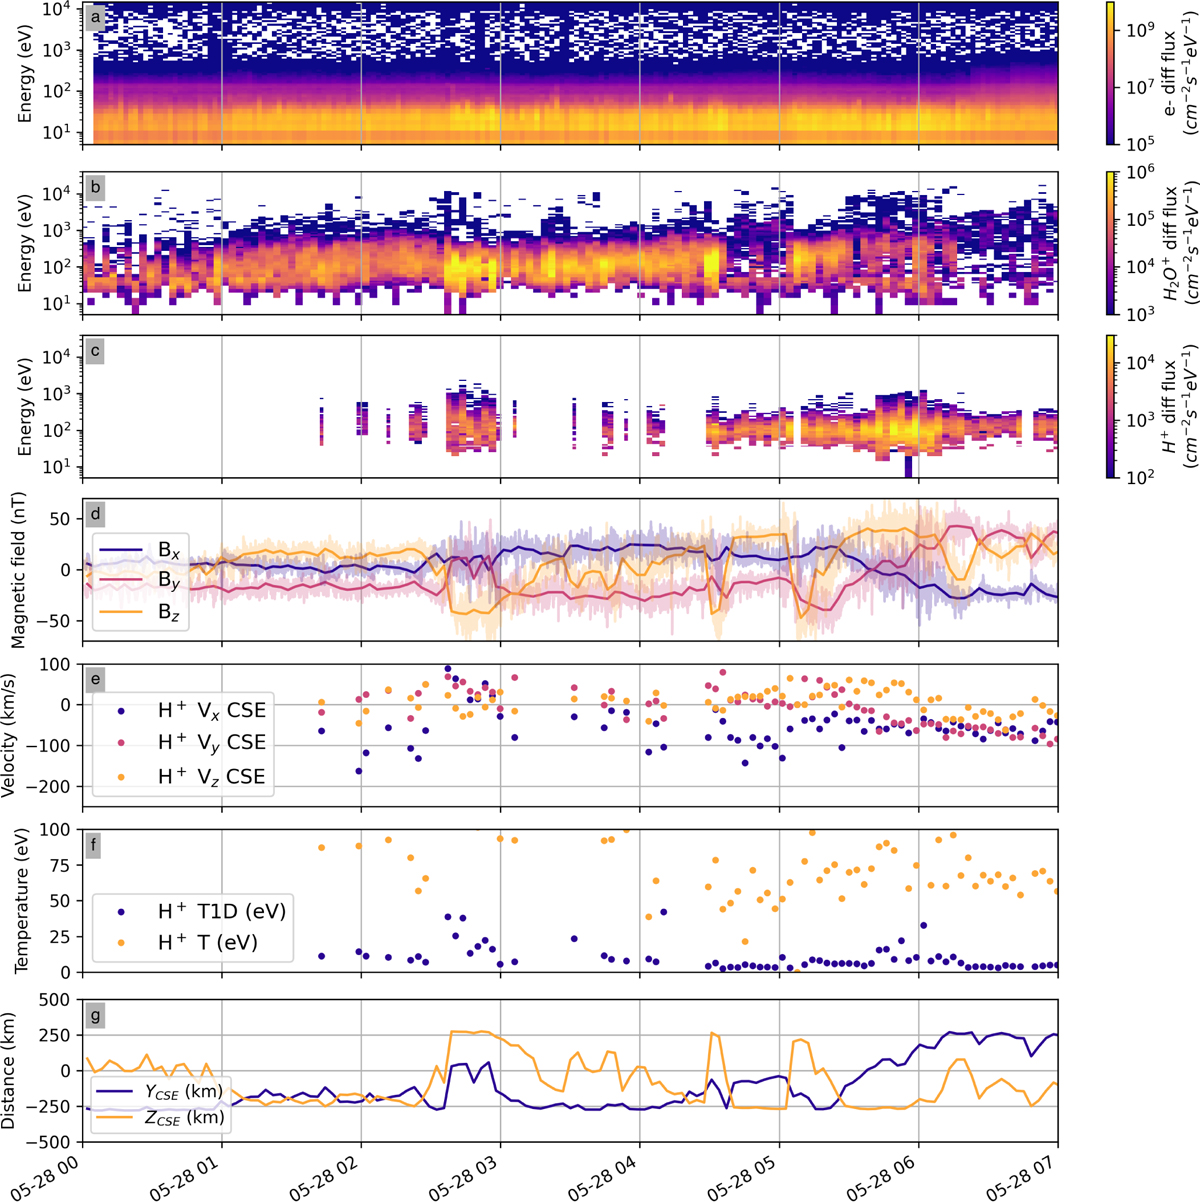
Overview of data from 28 May 2015. In all panels, the x-axis shows the time (UT). Top three panels: differential flux integrated over all observed angles using a colour-scale (cm−2 s−1 eV−1) with particle energy (eV) on the y-axis: electrons (panel a), water ions (panel b), and protons (panel c). Panel d: magnetic field components in the CSEQ coordinate system (nT). Thick lines are averaged over one ICA scan of 192 s. Panel e: proton velocity in the CSE reference frame (km/s). In both cases, dark blue is used for x, red for y, and orange for z. Panel f: integrated temperature estimates for protons. The one-dimensional temperature is shown in dark blue, and the three-dimensional temperature is given in orange. See the text for details on temperature calculations. Panel g: position of Rosetta in the y–z plane, with the distance along the magnetic field direction (CSE y) in dark blue and the distance along the electric field (CSE z) in orange (km).
Current usage metrics show cumulative count of Article Views (full-text article views including HTML views, PDF and ePub downloads, according to the available data) and Abstracts Views on Vision4Press platform.
Data correspond to usage on the plateform after 2015. The current usage metrics is available 48-96 hours after online publication and is updated daily on week days.
Initial download of the metrics may take a while.