Fig. 7
Download original image
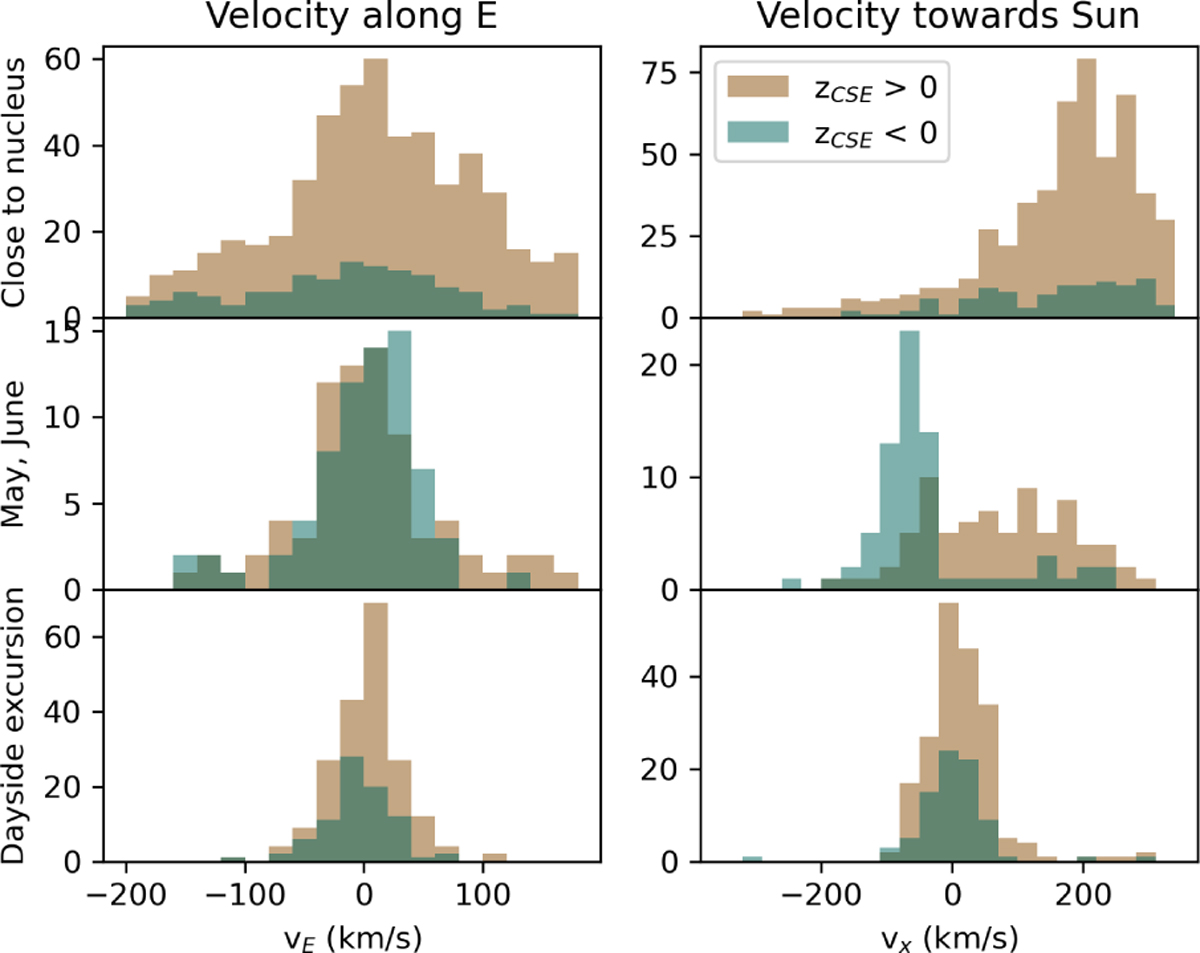
Histograms of proton speed observed close to the nucleus (upper panels) in May and June 2015 (middle panels) and during the dayside excursion (lower panels). Left panels: velocity along the electric field component in the y–z plane. Right panels: sunward velocity (km/s). Brown indicates data for positive zCSE, and blue–green indicates data for negative zCSE.
Current usage metrics show cumulative count of Article Views (full-text article views including HTML views, PDF and ePub downloads, according to the available data) and Abstracts Views on Vision4Press platform.
Data correspond to usage on the plateform after 2015. The current usage metrics is available 48-96 hours after online publication and is updated daily on week days.
Initial download of the metrics may take a while.