Fig. 8
Download original image
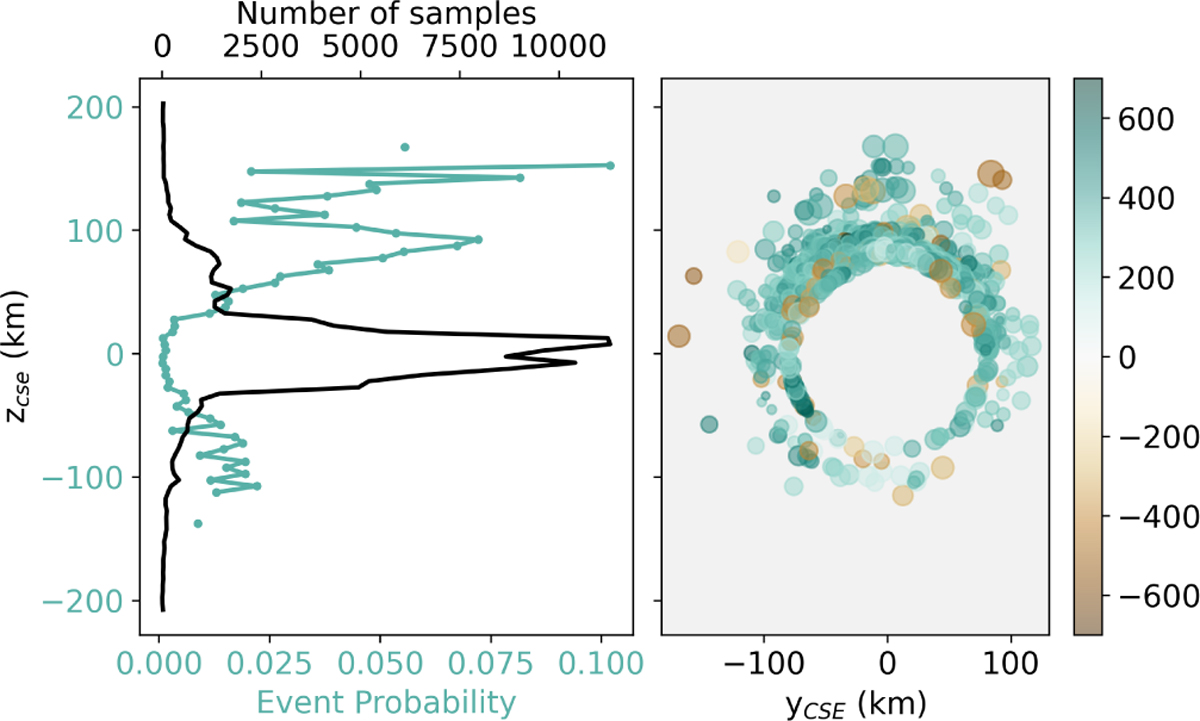
Left: occurrence frequency of solar wind observations (green line, lower x-axis), and total number of observations (black line, upper x-axis). Data are from periods 1 and 4 of Fig. 3, but at the beginning and end of the solar wind ion cavity. Right: zoomed-in view of Fig. 5 with the same zCSE axis as the left panel. The colour shows the speed of H+ with a sign from vx.
Current usage metrics show cumulative count of Article Views (full-text article views including HTML views, PDF and ePub downloads, according to the available data) and Abstracts Views on Vision4Press platform.
Data correspond to usage on the plateform after 2015. The current usage metrics is available 48-96 hours after online publication and is updated daily on week days.
Initial download of the metrics may take a while.