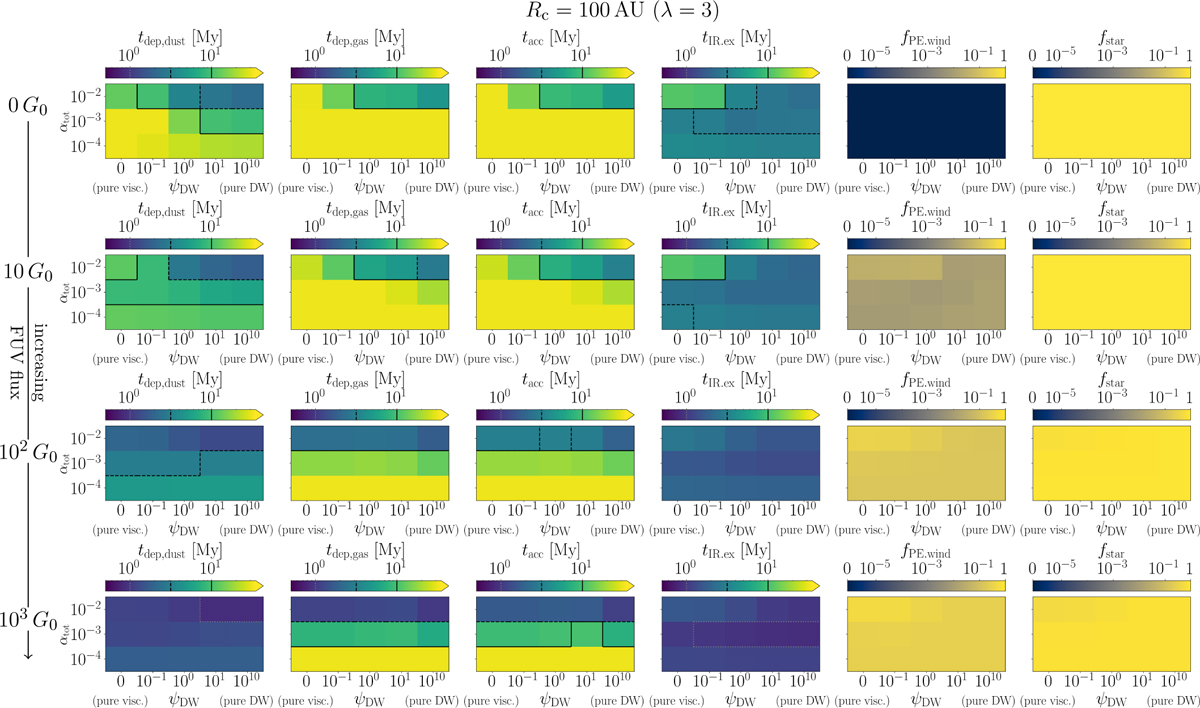
Fig. D.1
Download original image
Similar to Fig. 5, but displaying the dependence on αtot in the vertical axes, so each diagnostic is shown via a heat map. The fraction of dust mass accreted onto the star is also shown as an additional column on the right. Regions of the ψDW versus αtot parameter space where the timescales are above given thresholds (1 Myr, 3.16 Myr and 10 Myr) are marked by dotted, dashed, and solid black lines (same scheme as Figs. 5, 6)
Current usage metrics show cumulative count of Article Views (full-text article views including HTML views, PDF and ePub downloads, according to the available data) and Abstracts Views on Vision4Press platform.
Data correspond to usage on the plateform after 2015. The current usage metrics is available 48-96 hours after online publication and is updated daily on week days.
Initial download of the metrics may take a while.