| Issue |
A&A
Volume 707, March 2026
|
|
|---|---|---|
| Article Number | A74 | |
| Number of page(s) | 17 | |
| Section | Planets, planetary systems, and small bodies | |
| DOI | https://doi.org/10.1051/0004-6361/202558535 | |
| Published online | 04 March 2026 | |
Timescale diagnostics for saving viscous and MHD-wind-driven dusty discs from external photoevaporation
1
Dipartimento di Fisica, Università degli Studi di Milano,
Via Celoria 16,
20133
Milano,
Italy
2
School of Physics, Trinity College Dublin, the University of Dublin, College Green,
Dublin 2,
Ireland
★ Corresponding author: This email address is being protected from spambots. You need JavaScript enabled to view it.
Received:
12
December
2025
Accepted:
27
January
2026
Abstract
Context. The evolution of protoplanetary discs is a function of their internal processes and of the environment in which the discs are located. It is unclear if angular momentum is mainly removed viscously or by magnetic winds or by a combination of the two. While external photoevaporation is expected to severely influence disc evolution and eventually dispersal, there are observational limitations towards highly irradiated discs. Consequently, the interplay between these ingredients and their combined effects on the gas and dust distributions within the disc are poorly understood.
Aims. We investigate, for the first time, the evolution of both the gaseous and solid components of viscous, MHD-wind, or hybrid discs, in combination with external far-ultraviolet (FUV) driven mass loss. We tested which combinations of parameters may protect discs from the external irradiation, allowing the solid component to live long enough to allow planet formation to succeed.
Methods. We ran a suite of 1D simulations of smooth discs with varying initial sizes, different levels of viscous and MHD-wind stresses (modelled via an α parametrisation), and strengths of the external FUV environment. We then tracked disc properties such as their radii, various lifetime diagnostics, and the amount of dust removed by the photoevaporative wind, as a function of the underlying parameters.
Results. We find that the biggest role in determining the fate of discs is played by a combination of a disc’s ability to spread radially outwards and the strength of FUV-driven erosion. While MHD wind-driven discs experience less FUV erosion due to the lack of spread, they do not live for longer amounts of time compared to viscously evolving discs, especially at low-to-moderate FUV fluxes, while higher fluxes (≳100 G0) yield disc lifetimes that are rather insensitive to the disc’s angular momentum transport mechanism. Specifically, for the solid component, the biggest role is played by a combination of inward drift and removal by FUV winds. This points to the importance of other physical ingredients, such as disc substructures, even in highly irradiated disc regions, to retain solids.
Key words: accretion, accretion disks / methods: numerical / planets and satellites: formation / protoplanetary disks
© The Authors 2026
 Open Access article, published by EDP Sciences, under the terms of the Creative Commons Attribution License (https://creativecommons.org/licenses/by/4.0), which permits unrestricted use, distribution, and reproduction in any medium, provided the original work is properly cited.
This article is published in open access under the Subscribe to Open model. This email address is being protected from spambots. You need JavaScript enabled to view it. to support open access publication.
1 Introduction
Protoplanetary discs are regulated by the interplay of a number of internal and external physical processes that ultimately brought about the thousands of planets we observe today. Despite their fundamental role, many questions remain unanswered as to how these processes operate together. One question relates to the identification and quantification of the driving angular momentum transport mechanisms that are active within the disc (Manara et al. 2023). A second question concerns the role of the external environment in affecting the evolution of discs, as it possibly replenishes them with material (Winter et al. 2024), but ultimately drives their evaporation and dispersal (Winter & Haworth 2022). A third question relates to the response of the solid component, which eventually builds planetary cores, to these internal and external processes (Drążkowska et al. 2023).
Concerning internal stresses, angular momentum transport in accretion discs was classically attributed to an effective turbulent viscosity. Given our ignorance on many of the physical details, a convenient way to model this process is via a dimensionless parameter, αSS (Shakura & Sunyaev 1973), that simply represents the ratio of radial stresses to pressure. A relatively large αSS ≃ 10−3–10−2 is needed to match observed accretion rates (Hartmann et al. 1998, 2016; Calvet et al. 2000; King et al. 2007; Manara et al. 2019). Observationally, the turbulent αSS can be constrained between 10−4 and a few 10−2 (Pinte et al. 2016; Rafikov 2017; Dullemond et al. 2018; Flaherty et al. 2017, 2018; Villenave et al. 2022; see Rosotti 2023 for a review). Theoretical results show that αSS can be maintained above ≃10−4 by various hydrodynamical or gravitational instabilities (e.g. Urpin & Brandenburg 1998; Lovelace et al. 1999; Gammie 2001; Stoll & Kley 2014; Rafikov 2015; Kratter & Lodato 2016; Latter 2016; Pfeil & Klahr 2021; Flock et al. 2020; see Lesur et al. 2023 for a recent review), while magneto-hydrodynamical (MHD) effects, such as the magneto-rotational instability (MRI; Velikhov 1959; Balbus & Hawley 1991) can drive αSS up to 10−2 in magnetically active regions of the disc. Additionally, MHD disc winds (Blandford & Payne 1982; Wardle & Koenigl 1993; Ferreira 1997; Suzuki & Inutsuka 2009) have been invoked as a mechanism for angular momentum transport, and this alternative has recently been gaining traction (Turner et al. 2014; Suzuki et al. 2016; Bai 2016; Tabone et al. 2022a, 2022b; Pascucci et al. 2023). Whether discs are mainly viscously or MHD-wind driven is a topic of active research and observationally unresolved (e.g. Zagaria et al. 2022; Alexander et al. 2023; Somigliana et al. 2023; Zallio et al. 2024; Tabone et al. 2025; Weber et al. 2025, and recent review by Manara et al. 2023).
In fact, Coleman et al. (2024) recently showed that external processes can obfuscate the distinction between viscously driven and MHD-disc-wind-driven angular momentum transport inside the disc, highlighting the importance of the interplay between internal stresses and the environment. The dominant environmental influence is the irradiation from external EUV or FUV (extreme and far ultraviolet) photons (e.g. Johnstone et al. 1998; Adams et al. 2004; see review by Winter & Haworth 2022). When a disc is subject to intense external radiation from other nearby massive stars, the heat produced in the outer layers can drive a thermal wind that allows material to escape the central star’s potential well. This process removes mass (typically, FUV irradiation dictates the mass loss rate), truncates the disc, and thereby strongly affects disc evolution.
Despite its importance, external photoevaporation of protoplanetary discs is a poorly constrained process. The count of star-forming regions (SFRs) with few stars (less than a few hundred) is high, so these SFRs are commonly found close to Earth, are easily observed, and have been thoroughly covered by surveys (e.g. Andrews et al. 2013, 2018; Ansdell et al. 2016, 2018; Tazzari et al. 2021; Pascucci et al. 2016; Barenfeld et al. 2016; Long et al. 2018; Cieza et al. 2019; Garufi et al. 2021; Zhang et al. 2025). These regions have initial mass functions (IMFs) skewed towards low-mass K and M dwarfs, where more massive stars (O and B types) are less frequent. This makes them especially suitable for high-resolution campaigns, such as with the Atacama Large Millimeter Array (ALMA), since their proximity (≲300 pc) and relative isolation minimises contamination and extinction and requires shorter observation times. On the other hand, they paint a rather biased picture of the environments in which protoplanetary discs evolve. As these close-in SFRs host few massive stars, they are not subject to high external FUV fluxes, which are thus limited to ~10 G0 (Winter et al. 2018; Anania et al. 2025a, 2025b; here, G0 is the Habing unit commonly used to measure FUV fluxes, Habing 1968). However, SFRs with a high number of stars (e.g. Orion, Carina, or Cygnus OB2) host within them such a large number that any given star taken at random across all SFRs is more likely to have been born with a massive star nearby (e.g. Fatuzzo & Adams 2008). In other words, the typical protoplanetary disc observed in surveys so far is not representative of the planet-hosting star in the galaxy in terms of its neighbouring environment, where the FUV flux may exceed 100–1000 G0.
On the theoretical side, previous works have modelled the response of the gas to FUV fields (Clarke 2007), including its dependence on the internal stresses (Coleman et al. 2024), and others have investigated what happens to dust under external irradiation (e.g. Sellek et al. 2020) or how theoretical predictions for purely viscous dusty discs within mild FUV environments relate to observations (Anania et al. 2025a). However, no study has systematically described the evolution of both the gas and the dust in viscously versus MHD-driven discs that are subject to external irradiation. This is the main aim of this paper. The specific question we tackle is what are conditions the dust component can survive long enough so that there is enough time for planet formation to occur. To answer this question, we performed 1D simulations of the dust and gas components of discs with various internal stresses and different external FUV fluxes and extracted disc lifetimes that relate to both the gas and the dust.
The rest of the paper is organised as follows. In Section 2, we describe the disc model and the parameter space investigated in this work. In Section 3 we present the main results for the evolution of gaseous and solid components. In Section 4, we discuss their relevance in the context of our current understanding of disc evolution, disc observations, and the assembly of planetary systems, and we discuss the limitations of our modelling. Finally, we conclude in Section 5.
2 Disc model
We begin by describing the underlying disc evolution model for both the gas and the dust. We envision a protoplanetary disc around a central star of mass M* while assuming axial symmetry and ignoring the vertical component for simplicity, making our model 1D in radius r. We treat the three main processes mentioned above, namely, angular momentum transport mechanisms, external environment (specifically, external FUV irradiation), and dust evolution, in Sections 2.1, 2.2, and 2.3 respectively. The numerical setup and parameter space explored in this paper are described in Section 2.4.
2.1 Surface density evolution and angular momentum transport
To describe the surface density and angular momentum evolution of the disc, we used the hybrid viscous and MHD-disc-wind model of Tabone et al. (2022a), with the addition of a mass-removal term due to external photoevaporative winds (described in more detail in the next subsection). We briefly present the main equations here and refer to the original paper for a more in-depth presentation. The driving equation is the continuity equation for the gas surface density, Σg, with sinks due to both MHD-wind-driven mass loss and external photoevaporation,
![Mathematical equation: $\[\begin{aligned}\frac{\partial \Sigma_{\mathrm{g}}}{\partial t} & -\frac{3}{r} \frac{\partial}{\partial r}\left[\frac{1}{r \Omega_{\mathrm{K}}} \frac{\partial}{\partial r}\left[\alpha_{\mathrm{SS}} c_{\mathrm{s}}^2 r^2 \Sigma_{\mathrm{g}}\right]\right] \\& -\frac{3}{2 r} \frac{\partial}{\partial r}\left[\frac{1}{\Omega_{\mathrm{K}}} \alpha_{\mathrm{DW}} c_{\mathrm{s}}^2 \Sigma_{\mathrm{g}}\right]+\frac{3}{4} \frac{\alpha_{\mathrm{DW}} c_{\mathrm{s}}^2 \Sigma_{\mathrm{g}}}{(\lambda-1) \Omega_{\mathrm{K}} r^2} \\& +\dot{\Sigma}_{\mathrm{g}, \text {evap}}(r)=0.\end{aligned}\]$](/articles/aa/full_html/2026/03/aa58535-25/aa58535-25-eq1.png) (1)
(1)
The orbital frequency is ![Mathematical equation: $\[\Omega_{\mathrm{K}}=\sqrt{\mathcal{G} M_{*} / r^{3}}\]$](/articles/aa/full_html/2026/03/aa58535-25/aa58535-25-eq2.png) (where 𝒢 is the gravitational constant and M* is the star mass) such that the reference unperturbed azimuthal velocity is vg,ϕ,0 = vK = rΩK; the radial velocity of the gas is vg,r (in other words, its perturbation from the reference unperturbed value of 0). The isothermal sound speed cs is linked to surface density Σg and (vertically integrated) pressure P by
(where 𝒢 is the gravitational constant and M* is the star mass) such that the reference unperturbed azimuthal velocity is vg,ϕ,0 = vK = rΩK; the radial velocity of the gas is vg,r (in other words, its perturbation from the reference unperturbed value of 0). The isothermal sound speed cs is linked to surface density Σg and (vertically integrated) pressure P by ![Mathematical equation: $\[P=\Sigma_{\mathrm{g}} c_{\mathrm{s}}^{2}\]$](/articles/aa/full_html/2026/03/aa58535-25/aa58535-25-eq3.png) , to the aspect ratio, h = H/r, by h = cs/vK (where H is the disc’s vertical scale-height), and to the temperature T by
, to the aspect ratio, h = H/r, by h = cs/vK (where H is the disc’s vertical scale-height), and to the temperature T by ![Mathematical equation: $\[c_{\mathrm{s}}^{2}=\frac{k_{\mathrm{b}} T}{\mu m_{\mathrm{p}}}\]$](/articles/aa/full_html/2026/03/aa58535-25/aa58535-25-eq4.png) (where kb is the Boltzmann constant and μ is the mean molecular weight of the gas in units of the proton mass mp).
(where kb is the Boltzmann constant and μ is the mean molecular weight of the gas in units of the proton mass mp).
We now turn to the parameters αSS and αDW that appear in Eq. (1). Following the approach of Shakura & Sunyaev (1973), these quantities conveniently parametrise the (time-averaged) radial stress tensor (describing the radial transport of angular momentum) and the vertical stress tensor (describing the extraction of angular momentum by the MHD wind), respectively, including both Reynolds and Maxwell stresses1. Following Tabone et al. (2022a), we assume constant αSS and αDW for simplicity throughout. We then define a total α parameter,
![Mathematical equation: $\[\alpha_{\mathrm{tot}}:=\alpha_{\mathrm{SS}}+\alpha_{\mathrm{DW}} .\]$](/articles/aa/full_html/2026/03/aa58535-25/aa58535-25-eq5.png) (2)
(2)
Although convenient (Tabone et al. 2022a, see also e.g. Zagaria et al. 2022), we note that no actual physical meaning should be attached to this quantity, as it sums α parameters arising from two processes of fundamentally different nature (diffusion and advection). Finally, we introduce the relative strength between the α parameters associated to the radial transport and vertical extraction of angular momentum (Tabone et al. 2022a),
![Mathematical equation: $\[\psi_{\mathrm{DW}}:=\frac{\alpha_{\mathrm{DW}}}{\alpha_{\mathrm{SS}}} .\]$](/articles/aa/full_html/2026/03/aa58535-25/aa58535-25-eq6.png) (3)
(3)
Thus, ψDW = 0 represents a purely viscous disc, while ψDW ≫ 1 represents a purely MHD-disc-wind evolution model.
As in Shakura & Sunyaev (1973), one can parametrise ![Mathematical equation: $\[\nu_{\mathrm{SS}} \Omega_{\mathrm{K}}=\alpha_{\mathrm{SS}} c_{\mathrm{s}}^{2}\]$](/articles/aa/full_html/2026/03/aa58535-25/aa58535-25-eq7.png) and
and ![Mathematical equation: $\[\nu_{\mathrm{DW}} \Omega_{\mathrm{K}}=\alpha_{\mathrm{DW}} c_{\mathrm{s}}^{2}\]$](/articles/aa/full_html/2026/03/aa58535-25/aa58535-25-eq8.png) . Thus, νSS plays the usual role of the effective momentum diffusivity arising from radial stresses. We make use of the locally isothermal approximation, and write
. Thus, νSS plays the usual role of the effective momentum diffusivity arising from radial stresses. We make use of the locally isothermal approximation, and write ![Mathematical equation: $\[c_{\mathrm{s}}^{2} \propto T \propto r^{-\beta_{\mathrm{T}}}\]$](/articles/aa/full_html/2026/03/aa58535-25/aa58535-25-eq9.png) with a constant βT. We follow Sellek et al. (2020) and use a fiducial value of βT = 1/2, so that νSS ∝ rγvisc with γvisc = 3/2 − βT = 1. This profile is appropriate for the standard passive irradiated disc regime, where stellar irradiation dominates the dust temperature (Kenyon & Hartmann 1987; Chiang & Goldreich 1997), and consistent with observational considerations (Hartmann et al. 1998; Andrews & Williams 2005; Hartmann et al. 2016).
with a constant βT. We follow Sellek et al. (2020) and use a fiducial value of βT = 1/2, so that νSS ∝ rγvisc with γvisc = 3/2 − βT = 1. This profile is appropriate for the standard passive irradiated disc regime, where stellar irradiation dominates the dust temperature (Kenyon & Hartmann 1987; Chiang & Goldreich 1997), and consistent with observational considerations (Hartmann et al. 1998; Andrews & Williams 2005; Hartmann et al. 2016).
The last parameter in Eq. (1) is the magnetic lever arm parameter ![Mathematical equation: $\[\lambda=\frac{h_{\mathrm{DW}}(r)}{r \Omega_{\mathrm{K}}(r)}\]$](/articles/aa/full_html/2026/03/aa58535-25/aa58535-25-eq10.png) , where hDW(r) is the (specific) angular momentum carried away along the MHD-wind streamline anchored at r. One can show from energy conservation arguments that λ > 3/2 and typical values from observations are consistent with values between 1.6 and 5 (Tabone et al. 2022a). We take a reference fiducial value of 3. The second-to-last term in Eq. (1) represents an MHD wind-driven mass-loss term (a sink),
, where hDW(r) is the (specific) angular momentum carried away along the MHD-wind streamline anchored at r. One can show from energy conservation arguments that λ > 3/2 and typical values from observations are consistent with values between 1.6 and 5 (Tabone et al. 2022a). We take a reference fiducial value of 3. The second-to-last term in Eq. (1) represents an MHD wind-driven mass-loss term (a sink),
![Mathematical equation: $\[\dot{\Sigma}_{\mathrm{g}, \mathrm{DW}}:=\frac{3}{4} \frac{\alpha_{\mathrm{DW}} c_{\mathrm{s}}^2 \Sigma_{\mathrm{g}}}{(\lambda-1) \Omega_{\mathrm{K}} r^2} .\]$](/articles/aa/full_html/2026/03/aa58535-25/aa58535-25-eq11.png) (4)
(4)
Introducing the MHD disc wind velocity,
![Mathematical equation: $\[v_{\mathrm{DW}}:=\frac{3}{2} \frac{1}{r} \frac{\alpha_{\mathrm{DW}} c_{\mathrm{s}}^2}{\Omega_{\mathrm{K}}},\]$](/articles/aa/full_html/2026/03/aa58535-25/aa58535-25-eq12.png) (5)
(5)
we have ![Mathematical equation: $\[\dot{\Sigma}_{\mathrm{g}, \mathrm{DW}} \equiv \frac{v_{\mathrm{DW}} \Sigma_{\mathrm{g}}}{2(\lambda-1) r}\]$](/articles/aa/full_html/2026/03/aa58535-25/aa58535-25-eq13.png) . The total (radial) local mass flux reads
. The total (radial) local mass flux reads
![Mathematical equation: $\[\Sigma_{\mathrm{g}} v_{\mathrm{g}, r}=-\frac{3}{r^2 \Omega_{\mathrm{K}}} \frac{\partial}{\partial r}\left[\alpha_{\mathrm{SS}} c_{\mathrm{s}}^2 r^2 \Sigma_{\mathrm{g}}\right]-\Sigma_{\mathrm{g}} v_{\mathrm{DW}},\]$](/articles/aa/full_html/2026/03/aa58535-25/aa58535-25-eq14.png) (6)
(6)
with the first term being the local mass flux driven by turbulence and the second being the local mass flux driven by the MHD wind.
For the initial conditions, as in Sellek et al. (2020) (see also e.g. Zagaria et al. 2022; Anania et al. 2025a), we used the self-similar solution of Lynden-Bell & Pringle (1974) for the surface density:
![Mathematical equation: $\[\Sigma_{\mathrm{g}}(r ; t=0)=\Sigma_{\mathrm{g}, 0}\left(\frac{r}{R_{\mathrm{c}}}\right)^{-\gamma_{\mathrm{visc}}} \exp \left(-\frac{r}{R_{\mathrm{c}}}\right)^{2-\gamma_{\mathrm{visc}}} .\]$](/articles/aa/full_html/2026/03/aa58535-25/aa58535-25-eq15.png) (7)
(7)
The reference cut-off radius Rc sets the initial disc size, and γvisc = 3/2 − βT, which equals 1 with our fiducial βT = 1/2.
2.2 External photoevaporation
Our treatment of external photoevaporation closely follows that of Sellek et al. (2020) and Anania et al. (2025a). We prescribe a photoevaporative mass-loss rate![Mathematical equation: $\[\dot{\Sigma}_{\text {g,evap}}(r)\]$](/articles/aa/full_html/2026/03/aa58535-25/aa58535-25-eq16.png) in Eq. (1) as follows. We used the updated FRIEDv2 grid of Haworth et al. (2023) with a fiducial ratio between the polycyclic aromatic hydrocarbon (PAH) abundance and the dust abundance of 1 (see Appendix A for a quantitative comparison with the original FRIED grid from Haworth et al. 2018, used e.g. in Sellek et al. 2020). Given a fixed M* and an FUV flux, we obtain a local mass-loss rate
in Eq. (1) as follows. We used the updated FRIEDv2 grid of Haworth et al. (2023) with a fiducial ratio between the polycyclic aromatic hydrocarbon (PAH) abundance and the dust abundance of 1 (see Appendix A for a quantitative comparison with the original FRIED grid from Haworth et al. 2018, used e.g. in Sellek et al. 2020). Given a fixed M* and an FUV flux, we obtain a local mass-loss rate ![Mathematical equation: $\[\dot{\tilde{M}}_{\mathrm{g}, \mathrm{evap}, i}\]$](/articles/aa/full_html/2026/03/aa58535-25/aa58535-25-eq17.png) at each radius ri (where ri are the radial cell centres used in the code as described in Subsect. 2.4), using a bilinear interpolation of the FRIEDv2 grid over ri and Σg (ri). This
at each radius ri (where ri are the radial cell centres used in the code as described in Subsect. 2.4), using a bilinear interpolation of the FRIEDv2 grid over ri and Σg (ri). This ![Mathematical equation: $\[\dot{\tilde{M}}_{\mathrm{g}, \mathrm{evap}, i}\]$](/articles/aa/full_html/2026/03/aa58535-25/aa58535-25-eq18.png) is, however, not the actual local mass-loss rate that should be used. This is because, as shown by Sellek et al. (2020), the photoevaporation rate first increases with ri in the weakly bound regions that are optically thick in the FUV and then decrease with ri in the optically thin region. However, the flow in the outermost, optically thin disc region is actually set by the larger rates from the closer-in, optically thick disc regions. Thus, simply applying the local mass-loss rate from the FRIEDv2 grid at ri, taken at face value, would be unphysical. This is because the local mass-loss rate in the optically thin region assumes that the region interior to it does not flow in the wind, which is in reality not the case. Sellek et al. (2020) showed that the actual mass-loss rate is set at (and slightly outside of) the radius located at the transition between the optically thick and optically thin regimes. This so-called truncation radius Rt (see also Anania et al. 2025a) is the radial location that maximises the mass-loss rate
is, however, not the actual local mass-loss rate that should be used. This is because, as shown by Sellek et al. (2020), the photoevaporation rate first increases with ri in the weakly bound regions that are optically thick in the FUV and then decrease with ri in the optically thin region. However, the flow in the outermost, optically thin disc region is actually set by the larger rates from the closer-in, optically thick disc regions. Thus, simply applying the local mass-loss rate from the FRIEDv2 grid at ri, taken at face value, would be unphysical. This is because the local mass-loss rate in the optically thin region assumes that the region interior to it does not flow in the wind, which is in reality not the case. Sellek et al. (2020) showed that the actual mass-loss rate is set at (and slightly outside of) the radius located at the transition between the optically thick and optically thin regimes. This so-called truncation radius Rt (see also Anania et al. 2025a) is the radial location that maximises the mass-loss rate ![Mathematical equation: $\[\dot{\tilde{M}}_{\mathrm{g}, \mathrm{evap}, i}\]$](/articles/aa/full_html/2026/03/aa58535-25/aa58535-25-eq19.png) (the one obtained from the FRIED grid assuming the radial cell centre ri to be the outer radius of the disc, Sellek et al. 2020). Mass removal by external FUV can thus be implemented inside-out, at radii r > Rt (i.e., over the radial grid, at radii ri with i > it). First, we obtain a total mass-loss rate given by
(the one obtained from the FRIED grid assuming the radial cell centre ri to be the outer radius of the disc, Sellek et al. 2020). Mass removal by external FUV can thus be implemented inside-out, at radii r > Rt (i.e., over the radial grid, at radii ri with i > it). First, we obtain a total mass-loss rate given by
![Mathematical equation: $\[\dot{M}_{\mathrm{g}, \text {tot,evap}}=\sum_{i>i_{\mathrm{t}}} \dot{\tilde{M}}_{\mathrm{g}, \text {evap}, i} \frac{M_{\mathrm{g}, i}}{M_{\mathrm{g}}(r>R_{\mathrm{t}})} .\]$](/articles/aa/full_html/2026/03/aa58535-25/aa58535-25-eq20.png) (8)
(8)
Then, this mass-loss rate is distributed at larger radii in proportion to the local mass. The effective local mass-loss rate is thus
![Mathematical equation: $\[\dot{M}_{\mathrm{g}, \text {evap}, i}=\dot{M}_{\mathrm{g}, \text {tot,evap}} \frac{M_{\mathrm{g}, i}}{M_{\mathrm{g}}(r>R_{\mathrm{t}})} .\]$](/articles/aa/full_html/2026/03/aa58535-25/aa58535-25-eq21.png) (9)
(9)
This yields the sink term in the surface density evolution equation (Eq. (1)) with ![Mathematical equation: $\[\dot{M}_{\mathrm{g}, \text {evap}}(r)=2 \pi r ~\Delta r ~\dot{\Sigma}_{\mathrm{g}, \text {evap}}(r)\]$](/articles/aa/full_html/2026/03/aa58535-25/aa58535-25-eq22.png) .
.
2.3 Dust component
Equation (1) describes the evolution of the gas. When dealing with dust, we use the two-population model of Birnstiel et al. (2012) (see also Booth et al. 2017; Sellek et al. 2020), which we briefly describe here. The dust component can either be in a small grain population (with fixed monomer size a0 = 0.1 μm, which is also the initial size of the dust; see Sellek et al. 2020) or in a large grain population with size a1, set by growth and limited by fragmentation and radial drift (which are the dominant factors in limiting growth in the inner and outer portions of the disc, respectively, Birnstiel et al. 2010). The two species have surface densities Σd,k, k = 0, 1, and the dust mass fractions are denoted by ϵd,k = Σd,k/Σtot, where Σtot = Σg + Σd,0 + Σd,1 is the total gas and dust surface density. The total dust mass fraction is ϵd := ϵd,0 + ϵd,1 and is initialised completely in the small grains population as ϵd(t = 0) = ϵd,0(t = 0) = 10−2 (Bohlin et al. 1978).
Dust evolution is driven by advection following the motion of the gas, radial drift due to drag from the gas, diffusion, and removal from external photoevaporation due to FUV irradiation. For each dust species the evolution is thus governed by (e.g. Birnstiel et al. 2010)
![Mathematical equation: $\[\frac{\partial \Sigma_{\mathrm{d}, k}}{\partial t}+\frac{1}{r} \frac{\partial}{\partial r}\left[r\left(\Sigma_{\mathrm{d}, k} v_{\mathrm{d}, k, r}-D_{\mathrm{d}, k} \frac{\partial}{\partial r}\left[\frac{\Sigma_{\mathrm{d}, k}}{\Sigma_{\mathrm{g}}}\right] \Sigma_{\mathrm{g}}\right)\right]=s_{\mathrm{d}, k} .\]$](/articles/aa/full_html/2026/03/aa58535-25/aa58535-25-eq23.png) (10)
(10)
The dust radial velocity vd,k,r has a drag component and radial drift component (e.g. Weidenschilling 1977; Testi et al. 2014)
![Mathematical equation: $\[v_{\mathrm{d}, k, r}=\frac{1}{1+\mathrm{St}_k^2} v_{\mathrm{g}, r}+\frac{2 \mathrm{St}_k}{1+\mathrm{St}_k^2} v_P,\]$](/articles/aa/full_html/2026/03/aa58535-25/aa58535-25-eq24.png) (11)
(11)
where vg,r is the radial velocity of the gas (see Eq. (6)), vP = −ηvK, and ![Mathematical equation: $\[\eta=-\frac{1}{2}\left(\frac{H}{r}\right)^{2} \frac{\partial ~\log~ P}{\partial ~\log~ r}\]$](/articles/aa/full_html/2026/03/aa58535-25/aa58535-25-eq25.png) . Moreover, vd,k,r strongly depends on the Stokes number Stk, which in the Epstein drag regime can be written as (Birnstiel et al. 2012)
. Moreover, vd,k,r strongly depends on the Stokes number Stk, which in the Epstein drag regime can be written as (Birnstiel et al. 2012)
![Mathematical equation: $\[\mathrm{St}_k=\frac{\pi}{2} \frac{a_k \rho_{\mathrm{s}}}{\Sigma_{\mathrm{g}}},\]$](/articles/aa/full_html/2026/03/aa58535-25/aa58535-25-eq26.png) (12)
(12)
assuming spherical particles with radius ak and material density ρs, which we take to be 1 g cm−3. The diffusion coefficient ![Mathematical equation: $\[D_{\mathrm{d}, k}=\frac{D_{\mathrm{g}}}{\mathrm{Sc}_{k}}\]$](/articles/aa/full_html/2026/03/aa58535-25/aa58535-25-eq27.png) , where the Schmidt number
, where the Schmidt number ![Mathematical equation: $\[\mathrm{Sc}_{k}=1+\mathrm{St}_{k}^{2}\]$](/articles/aa/full_html/2026/03/aa58535-25/aa58535-25-eq28.png) (Youdin & Lithwick 2007), and we take Dg = νg = νSS, simply the gas turbulent viscosity. Dust feedback onto the gas is included as in Booth et al. (2017) and Sellek et al. (2020), although it makes little difference due to small dust mass fractions.
(Youdin & Lithwick 2007), and we take Dg = νg = νSS, simply the gas turbulent viscosity. Dust feedback onto the gas is included as in Booth et al. (2017) and Sellek et al. (2020), although it makes little difference due to small dust mass fractions.
For the sink term sd,k in Eq. (10), we assumed that dust is only removed by external photoevaporation (but not by the MHD disc wind, see below). To model this process, we followed Facchini et al. (2016) and assumed that dust particles smaller than a size
![Mathematical equation: $\[a_{\mathrm{ent}}=\frac{1}{4 \pi \mathcal{F}} \frac{v_{\mathrm{th}} \dot{M}_{\mathrm{g}, \mathrm{evap}}}{\mathcal{G} M_* \rho_{\mathrm{s}}}\]$](/articles/aa/full_html/2026/03/aa58535-25/aa58535-25-eq29.png) (13)
(13)
are entrained in the photoevaporative wind, as the drag force produced by the wind on a grain smaller than this size over-comes the gravitational force on the grain due to the central star. In the formula above, ![Mathematical equation: $\[\mathcal{F}=\frac{H}{\sqrt{r^{2}+H^{2}}}\]$](/articles/aa/full_html/2026/03/aa58535-25/aa58535-25-eq30.png) is a geometric factor so that 4πℱ is the fraction of the solid angle subtended by the disc outer edge, and vth is the thermal velocity of the gas. With this, the entrained mass fraction fent can be worked out for a size distribution n(a) da ∝ a−p da as (Sellek et al. 2020)
is a geometric factor so that 4πℱ is the fraction of the solid angle subtended by the disc outer edge, and vth is the thermal velocity of the gas. With this, the entrained mass fraction fent can be worked out for a size distribution n(a) da ∝ a−p da as (Sellek et al. 2020)
![Mathematical equation: $\[f_{\mathrm{ent}}=\min \left[1,\left(\frac{a_{\mathrm{ent}}}{a_1}\right)^{4-p}\right],\]$](/articles/aa/full_html/2026/03/aa58535-25/aa58535-25-eq31.png) (14)
(14)
and the dust mass removed (locally) by the photoevaporative wind is thus ![Mathematical equation: $\[\dot{M}_{\mathrm{d}, \text {evap}}=f_{\text {ent}} \frac{M_{\mathrm{d}}}{M_{\mathrm{g}}} \dot{M}_{\mathrm{g}, \text {evap}}\]$](/articles/aa/full_html/2026/03/aa58535-25/aa58535-25-eq32.png) (all quantities evaluated at each grid cell).
(all quantities evaluated at each grid cell).
We note that we assumed that the MHD disc wind does not remove any dust, that is, there is no ![Mathematical equation: $\[\dot{\Sigma}_{\mathrm{d}, k, \mathrm{DW}}\]$](/articles/aa/full_html/2026/03/aa58535-25/aa58535-25-eq33.png) contribution to sd,k. The main reason for this is that the amount of dust removed by these winds represents only a small fraction of the total dust mass and including this effect would not significantly modify the picture (see also Appendix B, and the discussion in Sect. 6.2 of Zagaria et al. 2022).
contribution to sd,k. The main reason for this is that the amount of dust removed by these winds represents only a small fraction of the total dust mass and including this effect would not significantly modify the picture (see also Appendix B, and the discussion in Sect. 6.2 of Zagaria et al. 2022).
Parameters of our simulations.
2.4 Numerical scheme and parameter space
We solved the gas and dust evolution using a version of the DiscEvolution code originally described in Booth et al. 2017 (see also Appendix C) while the external photoevaporation routines follow Sellek et al. (2020) (see also Anania et al. 2025a). We used a radial grid from Rmin = 0.1 AU to a fiducial Rmax = 500 AU, with a resolution of Nr = 500 and a natural spacing ∝ r1/2 (similar to Anania et al. 2025a, with a slightly higher radial resolution). When αSS is above 0.5 × 10⁻³ and the disc is already initially large (Rc ≥ 100 AU), we extended the disc up to Rmax = 1000 AU and modified Nr = 700 accordingly. This is to avoid the outer edge of the disc from reaching too close to the grid outer boundary. This also allows us to safely use a zero-torque boundary condition at the outer edge, while we use an inner boundary condition that keeps a constant flux, appropriate for power law profiles (note that the inner disc quickly reaches a steady state, Tabone et al. 2022a). We experimented with different radial extents, resolutions and spacings and found consistent results.
Our fiducial setup consists of a disc around a M* = 1 M⊙ star (with a reference R* = 2.5 R⊙ and Teff,* = 4000 K) with initial disc mass Mdisc,0 = 100 MJup (i.e., Mdisc,0 ≃ 10−1 M*), which sets Σg,0 in equation (7). We also fix a reference aspect ratio h0 = 0.033 at 1 AU, while, given our locally isothermal assumption, h(r) ∝ rβf with βf = (−βT + 1)/2. Thus, h(r) ∝ r1/4 for our fiducial βT = 1/2. This gives a reference temperature of ≃ 280 K at 1 AU for a solar-mass star. We explore a grid of parameters αtot ∈ {10−4, 10−3, 10−2}, ψDW ∈ {0, 0.1, 1, 10, 1010} (where ψDW = 1010 represents the purely MHD-wind disc), a reference magnetic lever arm parameter λ = 3, external FUV fluxes G/G0 ∈ {0, 10, 100, 1000} (with a nominal PAH fraction fPAH = 1), and initial disc cut-off radii Rc/AU ∈ {10, 30, 100}. Table 1 presents the full set of parameters. In a companion paper, we explore the dependence of our results on underlying model parameters such as the initial disc mass, the stellar mass, the PAH fraction and the magnetic lever arm parameter (Pichierri et al., in prep.).
3 Results
3.1 Gas evolution
For the gas component alone, the coupling of purely viscously-evolving discs (VE discs) with external photoevaporation has been modelled for the first time by Clarke (2007), who showed that these discs follow a predictable evolution. As long as the accretion rate onto the star is larger than the mass-loss rate at the photoevaporative edge, the disc expands outwards and self-adjusts to a state where the outward viscous flow at the outer edge matches ![Mathematical equation: $\[\dot{M}_{\text {evap}}\]$](/articles/aa/full_html/2026/03/aa58535-25/aa58535-25-eq34.png) . When
. When ![Mathematical equation: $\[\dot{M}_{\text {acc}}\]$](/articles/aa/full_html/2026/03/aa58535-25/aa58535-25-eq35.png) is no longer larger than the photoevaporative rate, the disc outer edge moves inward on a timescale comparable to the local viscous timescale. Thus, VE discs experience a long-lived phase where the accretion rate onto the star matches the photoevaporative rate; they also lose memory of the initial disc cutoff radius Rc (Sellek et al. 2020). The evolution is expected to be different in the MHD-wind case (DW discs for short): these discs do not expand outwards (e.g. review by Manara et al. 2023), there is no restoring mechanism to reach a self-adjustment between the inner and outer regions, and the MHD-disc-wind mass removal mechanism is decoupled from external photoevaporation. Because there is no natural equilibrium state, a pure DW disc is then not independent of initial radius Rc at later times. These trends are shown in Figure 1 for a highly irradiated disc, 1000 G0, and with moderate total αtot = 10−3 (top row), as a function of different initial disc radii.
is no longer larger than the photoevaporative rate, the disc outer edge moves inward on a timescale comparable to the local viscous timescale. Thus, VE discs experience a long-lived phase where the accretion rate onto the star matches the photoevaporative rate; they also lose memory of the initial disc cutoff radius Rc (Sellek et al. 2020). The evolution is expected to be different in the MHD-wind case (DW discs for short): these discs do not expand outwards (e.g. review by Manara et al. 2023), there is no restoring mechanism to reach a self-adjustment between the inner and outer regions, and the MHD-disc-wind mass removal mechanism is decoupled from external photoevaporation. Because there is no natural equilibrium state, a pure DW disc is then not independent of initial radius Rc at later times. These trends are shown in Figure 1 for a highly irradiated disc, 1000 G0, and with moderate total αtot = 10−3 (top row), as a function of different initial disc radii.
Another consequence of the qualitatively different behaviour in VE versus DW discs is that, for a purely DW disc, the long-lived phase of disc evolution has ![Mathematical equation: $\[\dot{M}_{\text {acc}}>\dot{M}_{\text {evap}}\]$](/articles/aa/full_html/2026/03/aa58535-25/aa58535-25-eq36.png) . This is because either
. This is because either ![Mathematical equation: $\[\dot{M}_{\text {acc}}>\dot{M}_{\text {evap}}\]$](/articles/aa/full_html/2026/03/aa58535-25/aa58535-25-eq37.png) from the start (for compact discs), or (for larger disc)
from the start (for compact discs), or (for larger disc) ![Mathematical equation: $\[\dot{M}_{\text {evap}}\]$](/articles/aa/full_html/2026/03/aa58535-25/aa58535-25-eq38.png) quickly drops within less than 1 Myr, as material is not replenished at larger radial separations. Therefore, observing discs at random will preferentially reveal them at this evolutionary stage. Instead, sampling VE discs will typically reveal a
quickly drops within less than 1 Myr, as material is not replenished at larger radial separations. Therefore, observing discs at random will preferentially reveal them at this evolutionary stage. Instead, sampling VE discs will typically reveal a ![Mathematical equation: $\[\dot{M}_{\text {acc}}{-}\dot{M}_{\text {evap}}\]$](/articles/aa/full_html/2026/03/aa58535-25/aa58535-25-eq39.png) correlation. This explains the recent results from Weder et al. (2026), which propose distinguishing between the two angular momentum transport mechanisms by looking at accretion and evaporative mass loss rates (they specifically focused on Cygnus OB2, with FUV fluxes of order 102–104; Fig. 1 uses fluxes of 103 G0 for comparison). In particular, in the viscous case we expect an almost 1:1 relation between the two rates, while this is not the case for the (pure) MHD wind model. We note, however, that this distinction is almost completely lost in the hybrid model (ψDW = 1), where the little viscosity αSS is sufficient to recover the viscous spreading effects. To drive this point further, we perform mock-population synthesis experiments where we sample discs with a fixed ψDW, across (finite) FUV fluxes, αtot, and Rc randomly chosen across their respective ranges, performing ‘observations’ at random times with a uniform distribution 𝒰[0 My,31.6 My]. We plot in Figure 2 the observed
correlation. This explains the recent results from Weder et al. (2026), which propose distinguishing between the two angular momentum transport mechanisms by looking at accretion and evaporative mass loss rates (they specifically focused on Cygnus OB2, with FUV fluxes of order 102–104; Fig. 1 uses fluxes of 103 G0 for comparison). In particular, in the viscous case we expect an almost 1:1 relation between the two rates, while this is not the case for the (pure) MHD wind model. We note, however, that this distinction is almost completely lost in the hybrid model (ψDW = 1), where the little viscosity αSS is sufficient to recover the viscous spreading effects. To drive this point further, we perform mock-population synthesis experiments where we sample discs with a fixed ψDW, across (finite) FUV fluxes, αtot, and Rc randomly chosen across their respective ranges, performing ‘observations’ at random times with a uniform distribution 𝒰[0 My,31.6 My]. We plot in Figure 2 the observed ![Mathematical equation: $\[\dot{M}_{\text {acc}}\]$](/articles/aa/full_html/2026/03/aa58535-25/aa58535-25-eq40.png) versus
versus ![Mathematical equation: $\[\dot{M}_{\text {wind}}\]$](/articles/aa/full_html/2026/03/aa58535-25/aa58535-25-eq41.png) , defined as either
, defined as either ![Mathematical equation: $\[\dot{M}_{\text {wind}}=\dot{M}_{\text {evap}}\]$](/articles/aa/full_html/2026/03/aa58535-25/aa58535-25-eq42.png) or
or ![Mathematical equation: $\[\dot{M}_{\text {wind}}=\dot{M}_{\text {evap}}+\dot{M}_{\text {DW}}\]$](/articles/aa/full_html/2026/03/aa58535-25/aa58535-25-eq43.png) . Although very simplistic, this experiment shows how the
. Although very simplistic, this experiment shows how the ![Mathematical equation: $\[\dot{M}_{\text {acc}}{-}\dot{M}_{\text {evap}}\]$](/articles/aa/full_html/2026/03/aa58535-25/aa58535-25-eq44.png) correlation disappears with higher and higher ψDW.
correlation disappears with higher and higher ψDW.
We should keep in mind that this analysis does not include the role of internal photoevaporative winds. Moreover, Weber et al. (2025) recently found that it may be difficult distinguish between thermally driven and magnetically driven mass loss, which may obfuscate the distinction even further.
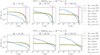 |
Fig. 1 Mass accretion rates, photoevaporative mass loss rates, and MHD-wind-driven mass loss rates for discs of different initial sizes and with different values of ψDW, namely ψDW = 0 (purely viscous disc, dotted lines), ψDW = 1 (hybrid disc, dashed lines), and ψDW ≫ 1 (purely MHD-wind disc, continuous lines). For explanatory purposes we consider here high irradiation, 1000 G0, and low-to-moderate total αtot = 10−4–10−3. The vertical dashed purple lines represent the gas disc lifetime diagnostic tdep,gas (see Sect. 3.3). |
3.2 Dust evolution
Dust evolution, in both the VE and DW cases, is driven by growth, radial drift and removal from external photoevaporation, and these processes compete with one another in making dust lifetimes longer or shorter. Dust that is well-coupled to the gas can follow its outward expansion in the viscous case. Similarly, dust diffusion is active when ψDW ≪ 1 (VE discs) but not in the MHD-wind case (because Dd = νSS/Sc, see Sect. 2.3). Since the photoevaporative mass-loss rate increases with radius in the optically thick regime (Sellek et al. 2020), external irradiation would cause DW discs to show longer lifetimes than their purely viscous counterparts. Instead, drift causes dust to move inward and accrete onto the star. When ψDW ≫ 1 (DW discs), because dust does not diffuse outward (as it does in the viscous case) it also has less of a radial displacement to cover; the relative efficiency of drift and gas drag will depend on the Stokes number. The fact that DW discs do not diffuse outwards also means that their surface density profiles in the outer disc will be steeper as they are carved out by external FUV irradiation, so that inward drift can be more efficient the outer regions depending on the disc’s initial size. Just as for the gas, an important difference is in the discs’ ability to expand via diffusion, which is fundamentally different for VE and DW discs (see Zagaria et al. 2022). But, as for the gas (Coleman et al. 2024), this difference can be strongly suppressed by high external FUV fluxes, which can obfuscate the distinction between the different angular momentum transport mechanisms.
The top row of Figure 3 shows the time evolution of R90%,d, defined as the radius that encloses 90% of the dust2, for an underlying FUV flux of 1000 G0, αtot = 10−3 and for various different Rc values. The total αtot is distributed either completely into αSS (ψDW = 0, purely viscous case, dashed transparent lines) or completely into αDW (ψDW ≫ 1, purely DW case, continuous opaque lines). The biggest difference arises in the Rc = 10 AU case, which, given the high FUV flux, is the only one here where the purely viscously evolving disc has a chance to expand. Across the top row of Figure 3, the ability of the dust disc to expand outwards is marked by an upward triangle, while we use a round marker for those setup where the radii do not significantly expand (for purely visual reasons, these symbols are positioned at the time tdep,dust when the dust disc is 1/1000 of the initial mass, see also second row of Fig. 3 and next subsection).
Because of drift, dust evolution happens on a different timescale than gas evolution, as can be seen comparing the bottom two rows of Fig. 3, specifically the vertical red and purple lines which represent dust and gas depletion timescales (see also Appendix B). As we show in greater detail in the next subsection, dust evolution typically happens faster (although marginally so) for DW discs compared to VE discs (see e.g. Fig. 3, specifically the vertical red lines which measure the dust depletion timescales on the top two rows). This result differs slightly from Coleman & van Terwisga (2025), which use a population synthesis approach to conclude that the median dust masses decrease faster for viscously evolving discs rather than MHD wind discs when exposed to external photoevaporation. This difference most likely arises from the fact that they do not explicitly solve for the evolution of the solid component as an additional species.
As expected, initially larger discs lose increasingly more dust to the photoevaporative (PE) wind, as shown in Figure 4 as a function of the dust mass fraction lost to the PE wind fPE.wind, and in accordance with Sellek et al. (2020). However, one difference of note is that the clear dependence on α for VE discs (see also Fig. A.1, right panel) is less and less measurable for DW discs: the amount of dust mass lost mostly depends on αSS in VE discs because of viscous spreading, while in the MHD wind case it mostly depends on initial disc size. Also note that, while larger discs are subjected to greater dust mass removal from external photoevaporation, this does not lead to them having shorter dust lifetimes because more compact discs tend to lose their dust more quickly onto the star.
 |
Fig. 2 Mass-accretion rate vs. the mass-loss rate in the wind (either the photoevaporative wind alone – blue dots –, or combined with the MHD wind – red dots), obtained from mock observations at random times, selected randomly from a uniform distribution in the interval [0 My, 31.6 My]. Each panel shows the outcome of these experiments for different fixed underlying ψDW = αDW/αSS, while the initial disc sizes, total αtot, and (finite) FUV fluxes are drawn randomly (values from Table 1). |
3.3 Disc lifetime diagnostics
We use four diagnostics to extract disc lifetimes from our simulations. We define tdep,gas and tdep,dust as, respectively, the times the gas mass falls below a given fraction f of the initial gas mass (see purple vertical line of bottom row of Fig. 3), and the same for the (total) dust mass (see middle row of Fig. 3, red vertical lines). We take that fraction to be f = 1/1000, as after this point the evolution happens fast enough that a change in f does not lead to a significant change in tdep,gas or tdep,dust. Then, tacc. is the time when the accretion rate onto the star falls below a given threshold, which we set to be 10−11 M⊙/yr. Finally, tIR.ex is the time when the dust surface density of the small grains at a reference radius of ![Mathematical equation: $\[\bar{R}=1\]$](/articles/aa/full_html/2026/03/aa58535-25/aa58535-25-eq45.png) AU is low enough that the disc becomes optically thin, so no IR excess would be detectable. We estimate the opacity of small grains to be κ0 ≃ 1000 cm2/g (e.g. Ossenkopf & Henning 1994), and we thus checked when
AU is low enough that the disc becomes optically thin, so no IR excess would be detectable. We estimate the opacity of small grains to be κ0 ≃ 1000 cm2/g (e.g. Ossenkopf & Henning 1994), and we thus checked when ![Mathematical equation: $\[\Sigma_{\mathrm{d}, 0}(\bar{R})\]$](/articles/aa/full_html/2026/03/aa58535-25/aa58535-25-eq46.png) falls below 1/κ0. We additionally track the fraction of dust mass removed by the photoevaporative wind fPE.wind and the fraction of dust mass that is accreted onto the star fstar.
falls below 1/κ0. We additionally track the fraction of dust mass removed by the photoevaporative wind fPE.wind and the fraction of dust mass that is accreted onto the star fstar.
The results for these diagnostics are shown in Figures 5 and 6 for various Rc and FUV fluxes, as a function of ψDW = αDW/αSS and αtot (see also Figs. D.1, D.2, and D.3). As we would expect, all timescales are shorter with higher external FUV fluxes, with a clear monotonic dependence (except for small Rc and high ψDW, see below). The short lifetimes of discs under high FUV fluxes coupled with high accretion rates is a known problem (so-called ‘proplyd lifetime problem’ due to the high mass-loss rates observed, e.g. Henney & O’Dell 1999; Störzer & Hollenbach 1999; O’Dell 2001, and more recently e.g. Winter et al. 2019). This raises the question of whether the angular momentum transport mechanism within the disc plays a role, and naively one would expect that DW discs, since they do not spread out, would be less susceptible to the effects of external FUV irradiation and thus possibly live longer.
In fact, we typically find that the opposite is true. Because the driving factor to dust evolution is radial drift, the main difference does come from the ability of the disc to spread out due to diffusion. As in Figure 3, we indicate those discs whose dust radii are able to initially expand with upward triangles in the first and fourth columns of Figures 5, 6 while those that do not are labelled with circles. Strikingly, however, this implies that dust in viscous discs actually tends to live longer than in purely DW disc. Indeed, we find that, although viscosity can replenish the outer regions, thus making VE discs more prone to losing dust via FUV winds (Fig. 3, middle row), this effect is completely overridden by the overall efficacy of dust radial drift driving accretion onto the central star (via the combined effect of the various processes mentioned at the beginning of Sect. 3): The dust in non radially expanding discs has less of a radial distance to cover and is thus removed more quickly. We therefore conclude that MHD winds do not protect the dust component of smooth discs from being eroded by moderate-to-strong external FUV environments, and in fact the opposite is true.
Results for tdep,dus. Higher FUV fluxes also muddle the distinction between low and high αtot, where a difference of this parameter of two orders of magnitude only leads to a difference in tdep,dust of a factor of a few. In light of this, initially larger discs, which are almost completely eroded from the outside in by stronger FUV fluxes, show a flat tdep,dust dependence on ψDW. Instead, initially very compact discs may still show signs of radial expansion even in very high FUV environments, at least for the highest αtot. This means that some ψDW dependence in tdep,dust is possible, but only for high αtot, with tdep,dust being a factor of a few lower for DW discs than for VE discs. This stronger dependence of tdep,dust on ψDW (as well as on αtot) in initially smaller discs is expected, as they will remain small if they are DW-driven, but not if they are viscously driven; then, smooth dusty DW discs will tend to live shorter lives because they quickly accrete all the dust onto the star. In higher FUV environments, αtot does not matter for ψDW ≪ 1 (VE discs) while it does for high ψDW (DW discs). In this latter case (because, again, DW discs do not spread outwards), external photo-evaporation actually plays a minor role and the behaviour is similar to what we would obtain at 0 G0. We also remark that, when the external FUV flux is very low, the αtot-dependence of tdep,dust flips from correlated to anti-correlated for fixed ψDW: tdep,dust increases with α when ψDW = 0, but decreases with α when ψDW ≫ 1. That said, we should keep in mind that differences of only a factor of a few in disc lifetimes may be hard to discern observationally due to the difficulty of accurately determining YSO ages. This would be especially cumbersome for high FUV environments, as they tend to be farther away.
Results for tdep,gas. The gas depletion timescale follows a trend similar to tdep,dust. Discs typically tend to live longer for lower ψDW, while this distinction is obfuscated by high FUV environments, especially for initially large discs. A noticeable difference with the dust is that the dependence on the total αtot remains instead very noticeable across all simulations. Moreover, except for the highest αtot, tdep,gas tends to be much larger than tdep,dust. This is again a consequence of dust radial drift. We recall again that the evolution of gas radii has been already studied e.g. in Coleman et al. (2024), which already pointed out how the evolution of radii can be indistinguishable in the DW and VE cases under high FUV irradiation (although they did not explicitly explore the dependence on Rc). tacc. shows clear correlation with tdep,gas, which is expected, as the local mass flux is proportional to Σg, (6), with tacc. ≳ tdep,gas. For purely viscously evolving discs, using ![Mathematical equation: $\[t_{\text {acc.}} \sim M_{\text {disc}} / \dot{M}_{\text {acc}}\]$](/articles/aa/full_html/2026/03/aa58535-25/aa58535-25-eq47.png) , the need for high αSS to match the median gas age of ≃ 3–5 My is in line with the classic results of Hartmann et al. (1998); Calvet et al. (2000).
, the need for high αSS to match the median gas age of ≃ 3–5 My is in line with the classic results of Hartmann et al. (1998); Calvet et al. (2000).
Results for tIR.ex. Concerning tIR.ex, we see that trends with ψDW are similar to tdep,dust: larger ψDW lead to shorter tIR.ex, with this difference being especially noticeable for those discs that are able to spread outward. Because tIR.ex tracks small dust, and most of the mass is in the large grains, we typically have that tIR.ex < tdep,dust. We also note that the dependence on αtot is less straightforward for tIR.ex than in tdep,dust. While tdep,dust shows a rather clear monotonicity with αtot (for a given fixed ψDW), with higher αtot typically leading to a smaller tdep,dust (except again for vanishing ψDW – i.e. VE discs – and small Rc as noted above, again due to disc spreading) this is not so for tIR.ex, which is typically lowest for intermediate αtot. The only exception to this is found for initially small discs and for ψDW ≳ 10.
Results for fPE.wind. Finally, looking at the dust mass fraction removed from the external photoevaporative wind, we find as expected (see Fig. 4 and Sect. 3.2) that fPE.wind is higher for higher αSS but it is insensitive to αDW since wind-driven advection does not replenish the outer regions with dust material (as one can most easily see from the limiting cases ψDW ≪ 1, i.e. VE discs, and ψDW ≫ 1, DW discs). For low total αtot, this dependence with ψDW is less severe, as even pure VE discs with low levels of turbulence have a hard time feeding dust into the outer regions. Moreover, at fixed ψDW ≲ 10, the increase of fPE.wind with αSS is somewhat lessened for initially large discs once αSS ≲ 10−3, since the disc is already large enough and photoevaporation efficiencies will be rather similar. Indeed we also find that, as expected, higher FUV fluxes will lead to larger fPE.wind (please note the different vertical scales in the last columns of Figs. 5 and 6 to accommodate for very different fPE.wind ranges across all setups). For a fixed αtot, fPE.wind typically decreases with ψDW, until it becomes almost insensitive to it once ψDW ≳ 10 (except in one case, namely Rc = 100 AU, FUV = 10 G0 where this trend is reversed, albeit by an extremely small amount). We stress again that, in this work, fPE.wind only tracks the dust that is removed by the external FUV wind, and we are not tracking dust that may be removed by MHD-disc winds (see Appendix B).
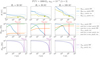 |
Fig. 3 Typical evolution of representative dust and gas quantities for either fully MHD-driven discs (continuous lines) or fully viscous discs (dashed lines), subjected to external photoevaporation, as a function of initial disc size Rc (different columns). Top row: dust radii R90%,d enclosing 90% of the dust mass and R90%,12CO, the radius that encloses 90% of the 12CO emission, calculated following Trapman et al. (2023). Upward triangles label the cases where the dust radii initially expand, while circles indicate those that do not, due to external irradiation. Middle row: time evolution of the total dust mass, mass accreted onto the star, and mass lost to wind. The vertical red lines denote the times when the dust mass reaches fraction of the initial mass (set to 1/1000). Bottom row: time evolution of the gas mass. Similarly to the dust, the vertical purple lines denote the times when the gas mass reaches 1/1000 of the initial mass. The underlying total αtot = 10−3 and the FUV flux is set to 1000 G0. |
 |
Fig. 4 Fraction of dust mass lost to wind as a function of the initial disc size, Rc, for different ψDW = αDW/αSS and αtot = αDW + αSS. |
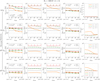 |
Fig. 5 Disc diagnostics as a function of ψDW = αDW/αSS for different total αtot = αDW + αSS (different colours and line styles, see legends in the last column) and for different FUV fluxes over different rows (see labels on the left along the arrow). In all cases, the disc’s initial size Rc = 100 AU. Upward pointing arrows at t = 31.6 My show that the data points represent lower bounds. First column: time when the total dust mass drops below 1/1000 of the initial dust mass (tdep,dus). Second column: time when the gas mass drops below 1/1000 of the initial gas mass (tdep,gas). Third column: Time at which the accretion rate onto the star drops below 10−11 M⊙/yr (tacc.). Fourth column: time when the disc would be undetectable due to lack of IR excess (tIR.ex); we estimate this as the time when the surface density of small dust at r = 1 AU drops below 1/κ0, with a reference opacity of small dust grains κ0 = 1000 cm2/g. Last column: fraction of dust mass lost to wind (note the somewhat inconsistent vertical axis range due to values spanning different orders of magnitude across the different setups; see also Fig. 4). As shown in the legend in the first and fourth columns (which relate to dust timescales), the upward triangles indicate runs where the dust disc radii initially expand due to significant diffusion, while circles indicate those setups that do not (see top row of Fig. 3). |
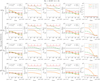 |
Fig. 6 Same as Fig. 5, but for initially compact discs, Rc = 10 AU. Note again the somewhat inconsistent vertical axis range for the dust mass fraction removed by the external photoevaporative wind fPE.wind. |
4 Discussion
One of the main findings of our work is that, unlike one may naively expect, the angular momentum transport mechanism plays a rather limited role in modulating the lifetimes of dusty discs exposed to higher (≳100 G0) FUV fluxes, and, if anything, DW discs tend in fact to live less than VE discs, both in the gas and in the dust. While the lifetime of the gaseous component still depends on the total αtot = αSS + αDW, the dust lifetimes are instead less sensitive to it. In any case, as one would expect, lower αtot lead to a slower evolution overall and thus somewhat longer disc lifetimes. As we showed in the previous section, this is mostly due to radial drift of dust, which falls onto the star rather quickly. The role of radial drift was already pointed out by Sellek et al. (2020) in the purely viscous case, who showed that it mitigates the external photoevaporation’s role in raising the dust to gas ratio in the disc. Since higher ψDW values do not help, one may turn to αtot. In principle, small αtot values do help in keeping dusty discs around for longer, at least for mild FUV fluxes, but as we noted above, the difference is rather small for more highly irradiated discs (FUV flux ≳100 G0, bottom rows of Figs. 5, 6s). This points to the role of processes in the disc that can halt the inward flux of solids, most notable substructures (Whipple 1972; Pinilla et al. 2012). For purely viscous discs, dust traps can be able to extend the dust lifetime for FUV fluxes up to ≲103 G0 as long as they are located inside the truncation radius (Gárate et al. 2024). Substructures are often observed in nearby discs in lowG0 environments (ALMA Partnership 2015; Andrews et al. 2016, 2018; Bae et al. 2023; Vioque et al. 2025). Some discs experiencing moderate-to-high irradiation have also been observed. In σ Orionis (FUV flux ≃102–103 G0), Huang et al. (2024) used the highest ALMA resolution possible and recovered substructures in eight out of eight discs in visibility modelling, with five of them have substructures unambiguously resolved in the image plane. Otter et al. (2021) observed 72 spatially resolved sources in the Orion Nebula, but with lower resolution, with some hints of the presence of substructures, although the bright large-scale emission makes it difficult to characterise disc morphology. Our work suggests that, when demographic surveys are performed for discs in high-G0 environments, if we observe old discs with dust, they should also have substructures.
We stress again that this conclusion is largely independent of whether the discs’ internal driving stresses are mainly viscous or MHD-driven. The question of telling the two mechanisms apart, as pointed out in the introduction, nevertheless remains crucial. In moderately to highly irradiated discs, it may unfortunately be challenging to directly disentangle hybrid discs from purely viscous discs. Indeed, as we showed in Section 3.1, hybrid and purely viscous discs display a rather similar correlations in the ![Mathematical equation: $\[\dot{M}_{\text {wind}}\]$](/articles/aa/full_html/2026/03/aa58535-25/aa58535-25-eq48.png) versus
versus ![Mathematical equation: $\[\dot{M}_{\text {acc}}\]$](/articles/aa/full_html/2026/03/aa58535-25/aa58535-25-eq49.png) space, especially when thermally and magnetically driven winds are hard to distinguish themselves (Weber et al. 2025).
space, especially when thermally and magnetically driven winds are hard to distinguish themselves (Weber et al. 2025).
4.1 Consequences for planet formation
The removal of dust via external winds (large fPE.wind) implies that fewer grains are able to drift inward and replenish the inner regions. This would also have consequences for the chemical abundances (e.g. C/O, overall metallicity, etc.). Although highly irradiated regions are still poorly constrained by observations, recent JWST observations of the high-mass SFR NGC 6357 (Ramírez-Tannus et al. 2023, 2025) seem to suggest that discs may be able to retain the ingredients necessary for rocky planet formation even in high FUV environments. Ndugu et al. (2024) underlined the role of efficient radial drift, which may imply that external FUV fluxes even up to 104 G0 do not cause significant differences in chemical abundances of the inner regions compared to non-irradiated discs. However, they did not model dust entrainment in the external photoevaporative wind. More recently, Calahan et al. (2025) used thermochemical modelling (but not including drift) to conclude that inner disc chemistry may be affected, but the impact would be noticeable only for highly irradiated discs (≳106 G0). We will extend the current model to include chemical abundances in gas and dust phases in a future paper.
Substructures are important locations for planet formation. As solids accumulate here (Pinilla et al. 2012), the dust-to-gas ratio locally increases, allowing growth, raising the efficiency of the streaming instability (Youdin & Goodman 2005), and thus causing rapid planetesimal formation Johansen et al. (2007). On the other hand, substructures are also believed to be a signpost for ongoing planet formation. It is still unclear if the substructures we see are indeed caused by planets as a general rule (e.g. Tzouvanou et al. 2023) and whether such planets would represent the progenitors of the giant population we observe today (e.g. Lodato et al. 2019; Müller-Horn et al. 2022). Although our work suggests that substructures may play a relevant role in highly irradiated regions regardless of the nature of the driving internal stresses, we are unable to draw a definite conclusion at this stage, as we did not explicitly include them in our model.
For smooth discs that are mainly DW-driven, dust may survive somewhat longer if αtot is low (e.g. in initially large discs, by a factor of up to ~10 for 10 G0, or a factor of 4–5 for 100 G0; see Fig. 5). Such low αSS environments would have implications for solid growth, with smaller turbulent velocities leading to larger grains and faster radial drift, as well as stronger mid-plane concentrations (Birnstiel 2024). A thinner solids layer leads to higher pebble accretion efficiency (Johansen & Lacerda 2010; Ormel & Klahr 2010; Lambrechts & Johansen 2014), although lower α also leads to a lower pebble isolation mass (Bitsch et al. 2018), that is, smaller planetary cores. Planet–disc interactions are also affected: the ability to sustain a positive corotation torques to counterbalance the (typically negative) differential Lindblad torque is quenched at low diffusivities due to saturation (Paardekooper et al. 2011; Baruteau et al. 2014; Jiménez & Masset 2017; McNally et al. 2019); eccentricity- and inclination-damping rates are also affected in low-viscosity discs (Pichierri et al. 2023, 2024). Orbital migration plays a crucial role in the assembly of planetary systems, as it often leads to assembly of resonant chains (e.g. Terquem & Papaloizou 2007; Cresswell & Nelson 2008; Cossou et al. 2014). Low turbulence also affects in a measurable way the excitation of these resonant states (e.g. Hühn et al. 2021) and thus their stability properties (Pichierri et al. 2018).
4.2 Limitations and future work
Our model paints an incomplete picture of disc evolution by making a number of simplifying assumptions. We considered an axi-symmetric and vanishingly thin disc where quantities are a function of radius only. We followed Tabone et al. (2022a) and adopted constant αSS and αDW in time and radius. A constant αSS with radius is likely unphysical, as local turbulence levels strongly depend on the disc’s ability to develop the MRI, itself a function of the ionisation level in the disc (Gammie 1996; Sano & Stone 2002; Fromang et al. 2002). A constant αDW may also not be realistic (e.g. Suzuki et al. 2016 showed it can depend on the local surface density and temperature). We will investigate non-constant α models in subsequent work. We are also ignoring some internal processes that can affect disc structure, which challenge the smooth discs assumption. Substructures may be caused by MHD winds themselves (Suriano et al. 2017, 2019; Riols & Lesur 2019; Riols et al. 2020; Hu et al. 2022). Internal photoevaporation (e.g. Alexander & Armitage 2007; Owen et al. 2011; Ercolano & Pascucci 2017; Picogna et al. 2019) also plays a role in the evolution, dispersal and delivery of solids to the inner region of the disc (Coleman & Haworth 2022; Weder et al. 2023, 2026; Lienert et al. 2024, 2025). However, external photoevaporation is expected to influence disc evolution throughout its whole life, whereas internal photoevaporation mainly drives final dispersal over a short final phase (Clarke et al. 2001). In any case, any process that would drive the formation of substructure is likely to have a measurable impact, since it would impede the efficient radial drift of dust. We also ignore other external processes that may be important and affect disc structure, such as ongoing infall (Padoan et al. 2005; Throop & Bally 2008; Klessen & Hennebelle 2010; Winter et al. 2024).
5 Conclusions
In this paper, we presented for the first time the evolution of both the gaseous and solid components in smooth discs that are viscously driven, MHD-wind driven, or both (hybrid discs), including the effect of external photoevaporation. The disc evolution model followed that of Tabone et al. (2022a), with the addition of external photoevaporation (Sellek et al. 2020; Haworth et al. 2018, 2023; Anania et al. 2025a), while the dust was modelled as a two population of small and large grains following Birnstiel et al. 2012 (see also Booth et al. 2017). We evolve discs around a solar-mass star with different initial sizes, and with different strengths of viscous and MHD-wind stresses, parametrised by two Shakura & Sunyaev (1973)-like parameters αSS and αDW. We vary the external FUV flux from 0 to 1000 G0, and track various dust and gas lifetimes as well as the fraction of dust mass removed by the photoevaporative wind fPE.wind.
We find that, in more highly irradiated discs, the dust depletion time tdep,dust is rather insensitive to the ratio αDW/αSS, with discs mostly driven by MHD winds having somewhat shorter lifetimes. This is because, while viscous discs spread out and are subjected to higher mass-loss rates from external photoevaporation for longer, inward dust drift onto the star results in faster dust mass depletion in MHD-wind discs, especially for initially small discs with high ‘total’ αtot = αDW + αSS. The dependence of tdep,dust on the total αtot is itself weakened in the highest FUV environments, with tdep,dust being only slightly longer for lower αtot. This shows that, in highly irradiated discs, the total and relative strengths of viscous and magnetic stresses play a rather limited role in determining the lifetime of the dust species. While smooth discs with lower αtot may be able to retain dust for somewhat longer, other physical processes may be more relevant to shaping the disc lifetimes in high FUV environments, such as substructures, which can halt the inward drift of solids (Whipple 1972; Pinilla et al. 2012).
The fraction fPE.wind of dust mass removed by the photoevaporative wind depends naturally on the FUV flux and the initial disc radius. It also shows a dependence on αDW/αSS across all FUV fluxes considered here, at least for discs that are initially small or for higher total αtot. As a general rule, fPE.wind is higher for viscous discs (low αDW/αSS), as these spread outwards and can replenish the outer disc regions. However, this effect is somewhat less prominent for discs that are initially already large, as they need not rely on diffusion to bring material outwards, and with total αtot ~ 10−4. This will have consequences for planet formation as a higher fPE.wind restricts the availability of solids and the chemical inventory in the inner disc.
Future work will address some limitations of this investigation, including additional effects that can give rise to substructures (e.g. internal photoevaporation or growing planetary cores). We will also add the tracing of chemical species to track the volatile delivery in the inner-most regions of discs and make predictions about important observables such as C/O ratios and metallicity.
Acknowledgements
GP and GR acknowledge support from the European Union (ERC Starting Grant DiscEvol, project number 101039651) and from Fondazione Cariplo, grant No. 2022-1217. RA acknowledges funding by the European Union through the E-BEANS ERC project (grant number 100117693). Neither the European Union nor the granting authority can be held responsible for them. GL acknowledges support by PRIN-MUR 20228JPA3A and by the European Union Next Generation EU, CUP: G53D23000870006. Views and opinions expressed are, however, those of the author(s) only and do not necessarily reflect those of the European Union or the European Research Council.
References
- Adams, F. C., Hollenbach, D., Laughlin, G., & Gorti, U. 2004, ApJ, 611, 360 [NASA ADS] [CrossRef] [Google Scholar]
- Alexander, R. D., & Armitage, P. J. 2007, MNRAS, 375, 500 [NASA ADS] [CrossRef] [Google Scholar]
- Alexander, R., Rosotti, G., Armitage, P. J., et al. 2023, MNRAS, 524, 3948 [NASA ADS] [CrossRef] [Google Scholar]
- ALMA Partnership (Brogan, C. L., et al.) 2015, ApJ, 808, L3 [Google Scholar]
- Anania, R., Rosotti, G. P., Gárate, M., et al. 2025a, ApJ, 989, 8 [Google Scholar]
- Anania, R., Winter, A. J., Rosotti, G., et al. 2025b, A&A, 695, A74 [NASA ADS] [CrossRef] [EDP Sciences] [Google Scholar]
- Andrews, S. M., & Williams, J. P. 2005, ApJ, 631, 1134 [Google Scholar]
- Andrews, S. M., Rosenfeld, K. A., Kraus, A. L., & Wilner, D. J. 2013, ApJ, 771, 129 [Google Scholar]
- Andrews, S. M., Wilner, D. J., Zhu, Z., et al. 2016, ApJ, 820, L40 [Google Scholar]
- Andrews, S. M., Huang, J., Pérez, L. M., et al. 2018, ApJ, 869, L41 [NASA ADS] [CrossRef] [Google Scholar]
- Ansdell, M., Williams, J. P., van der Marel, N., et al. 2016, ApJ, 828, 46 [Google Scholar]
- Ansdell, M., Williams, J. P., Trapman, L., et al. 2018, ApJ, 859, 21 [NASA ADS] [CrossRef] [Google Scholar]
- Bae, J., Isella, A., Zhu, Z., et al. 2023, in Astronomical Society of the Pacific Conference Series, 534, Protostars and Planets VII, eds. S. Inutsuka, Y. Aikawa, T. Muto, K. Tomida, & M. Tamura, 423 [Google Scholar]
- Bai, X.-N. 2016, ApJ, 821, 80 [Google Scholar]
- Bai, X.-N., & Stone, J. M. 2010, ApJ, 722, 1437 [NASA ADS] [CrossRef] [Google Scholar]
- Balbus, S. A., & Hawley, J. F. 1991, ApJ, 376, 214 [Google Scholar]
- Barenfeld, S. A., Carpenter, J. M., Ricci, L., & Isella, A. 2016, ApJ, 827, 142 [Google Scholar]
- Baruteau, C., Crida, A., Paardekooper, S.-J., et al. 2014, in Protostars and Planets VI, eds. H. Beuther, R. S. Klessen, C. P. Dullemond, & T. Henning, 667 [Google Scholar]
- Birnstiel, T. 2024, ARA&A, 62, 157 [Google Scholar]
- Birnstiel, T., Dullemond, C. P., & Brauer, F. 2010, A&A, 513, A79 [NASA ADS] [CrossRef] [EDP Sciences] [Google Scholar]
- Birnstiel, T., Klahr, H., & Ercolano, B. 2012, A&A, 539, A148 [NASA ADS] [CrossRef] [EDP Sciences] [Google Scholar]
- Bitsch, B., Morbidelli, A., Johansen, A., et al. 2018, A&A, 612, A30 [NASA ADS] [CrossRef] [EDP Sciences] [Google Scholar]
- Blandford, R. D., & Payne, D. G. 1982, MNRAS, 199, 883 [CrossRef] [Google Scholar]
- Bohlin, R. C., Savage, B. D., & Drake, J. F. 1978, ApJ, 224, 132 [Google Scholar]
- Booth, R. A., & Clarke, C. J. 2021, MNRAS, 502, 1569 [NASA ADS] [CrossRef] [Google Scholar]
- Booth, R. A., Clarke, C. J., Madhusudhan, N., & Ilee, J. D. 2017, MNRAS, 469, 3994 [Google Scholar]
- Calahan, J. K., Öberg, K., & Booth, A. 2025, ApJ, 991, 94 [Google Scholar]
- Calvet, N., Hartmann, L., & Strom, S. E. 2000, in Protostars and Planets IV, eds. V. Mannings, A. P. Boss, & S. S. Russell, 377 [Google Scholar]
- Chiang, E. I., & Goldreich, P. 1997, ApJ, 490, 368 [Google Scholar]
- Cieza, L. A., Ruíz-Rodríguez, D., Hales, A., et al. 2019, MNRAS, 482, 698 [Google Scholar]
- Clarke, C. J. 2007, MNRAS, 376, 1350 [NASA ADS] [CrossRef] [Google Scholar]
- Clarke, C. J., Gendrin, A., & Sotomayor, M. 2001, MNRAS, 328, 485 [NASA ADS] [CrossRef] [Google Scholar]
- Coleman, G. A. L., & Haworth, T. J. 2022, MNRAS, 514, 2315 [NASA ADS] [CrossRef] [Google Scholar]
- Coleman, G. A. L., & van Terwisga, S. E. 2025, arXiv e-prints [arXiv:2511.04410] [Google Scholar]
- Coleman, G. A. L., Mroueh, J. K., & Haworth, T. J. 2024, MNRAS, 527, 7588 [Google Scholar]
- Coleman, G. A. L., Haworth, T. J., & Qiao, L. 2025, MNRAS, 539, 1190 [Google Scholar]
- Cossou, C., Raymond, S. N., Hersant, F., & Pierens, A. 2014, A&A, 569, A56 [NASA ADS] [CrossRef] [EDP Sciences] [Google Scholar]
- Cresswell, P., & Nelson, R. P. 2008, A&A, 482, 677 [NASA ADS] [CrossRef] [EDP Sciences] [Google Scholar]
- Drążkowska, J., Bitsch, B., Lambrechts, M., et al. 2023, in Astronomical Society of the Pacific Conference Series, 534, Protostars and Planets VII, eds. S. Inutsuka, Y. Aikawa, T. Muto, K. Tomida, & M. Tamura, 717 [Google Scholar]
- Dullemond, C. P., Birnstiel, T., Huang, J., et al. 2018, ApJ, 869, L46 [NASA ADS] [CrossRef] [Google Scholar]
- Ercolano, B., & Pascucci, I. 2017, Roy. Soc. Open Sci., 4, 170114 [Google Scholar]
- Facchini, S., Clarke, C. J., & Bisbas, T. G. 2016, MNRAS, 457, 3593 [NASA ADS] [CrossRef] [Google Scholar]
- Fatuzzo, M., & Adams, F. C. 2008, ApJ, 675, 1361 [NASA ADS] [CrossRef] [Google Scholar]
- Ferreira, J. 1997, A&A, 319, 340 [Google Scholar]
- Flaherty, K. M., Hughes, A. M., Rose, S. C., et al. 2017, ApJ, 843, 150 [NASA ADS] [CrossRef] [Google Scholar]
- Flaherty, K. M., Hughes, A. M., Teague, R., et al. 2018, ApJ, 856, 117 [CrossRef] [Google Scholar]
- Flock, M., Turner, N. J., Nelson, R. P., et al. 2020, ApJ, 897, 155 [Google Scholar]
- Fromang, S., Terquem, C., & Balbus, S. A. 2002, MNRAS, 329, 18 [NASA ADS] [CrossRef] [Google Scholar]
- Gammie, C. F. 1996, ApJ, 457, 355 [Google Scholar]
- Gammie, C. F. 2001, ApJ, 553, 174 [Google Scholar]
- Gárate, M., Pinilla, P., Haworth, T. J., & Facchini, S. 2024, A&A, 681, A84 [NASA ADS] [CrossRef] [EDP Sciences] [Google Scholar]
- Garufi, A., Podio, L., Codella, C., et al. 2021, A&A, 645, A145 [EDP Sciences] [Google Scholar]
- Giacalone, S., Teitler, S., Königl, A., Krijt, S., & Ciesla, F. J. 2019, ApJ, 882, 33 [NASA ADS] [CrossRef] [Google Scholar]
- Habing, H. J. 1968, Bull. Astron. Inst. Netherlands, 19, 421 [Google Scholar]
- Hartmann, L., Calvet, N., Gullbring, E., & D’Alessio, P. 1998, ApJ, 495, 385 [Google Scholar]
- Hartmann, L., Herczeg, G., & Calvet, N. 2016, ARA&A, 54, 135 [Google Scholar]
- Haworth, T. J., Clarke, C. J., Rahman, W., Winter, A. J., & Facchini, S. 2018, MNRAS, 481, 452 [NASA ADS] [CrossRef] [Google Scholar]
- Haworth, T. J., Coleman, G. A. L., Qiao, L., Sellek, A. D., & Askari, K. 2023, MNRAS, 526, 4315 [NASA ADS] [CrossRef] [Google Scholar]
- Henney, W. J., & O’Dell, C. R. 1999, AJ, 118, 2350 [CrossRef] [Google Scholar]
- Hu, X., Li, Z.-Y., Zhu, Z., & Yang, C.-C. 2022, MNRAS, 516, 2006 [NASA ADS] [CrossRef] [Google Scholar]
- Huang, J., Ansdell, M., Birnstiel, T., et al. 2024, ApJ, 976, 132 [Google Scholar]
- Hühn, L.-A., Pichierri, G., Bitsch, B., & Batygin, K. 2021, A&A, 656, A115 [NASA ADS] [CrossRef] [EDP Sciences] [Google Scholar]
- Jiménez, M. A., & Masset, F. S. 2017, MNRAS, 471, 4917 [Google Scholar]
- Johansen, A., & Lacerda, P. 2010, MNRAS, 404, 475 [NASA ADS] [Google Scholar]
- Johansen, A., Oishi, J. S., Mac Low, M.-M., et al. 2007, Nature, 448, 1022 [Google Scholar]
- Johnstone, D., Hollenbach, D., & Bally, J. 1998, ApJ, 499, 758 [NASA ADS] [CrossRef] [Google Scholar]
- Kenyon, S. J., & Hartmann, L. 1987, ApJ, 323, 714 [Google Scholar]
- King, A. R., Pringle, J. E., & Livio, M. 2007, MNRAS, 376, 1740 [NASA ADS] [CrossRef] [Google Scholar]
- Klessen, R. S., & Hennebelle, P. 2010, A&A, 520, A17 [NASA ADS] [CrossRef] [Google Scholar]
- Kratter, K., & Lodato, G. 2016, ARA&A, 54, 271 [Google Scholar]
- Laibe, G., & Price, D. J. 2014a, MNRAS, 444, 1940 [Google Scholar]
- Laibe, G., & Price, D. J. 2014b, MNRAS, 440, 2136 [Google Scholar]
- Lambrechts, M., & Johansen, A. 2014, A&A, 572, A107 [NASA ADS] [CrossRef] [EDP Sciences] [Google Scholar]
- Latter, H. N. 2016, MNRAS, 455, 2608 [NASA ADS] [CrossRef] [Google Scholar]
- Lesur, G., Flock, M., Ercolano, B., et al. 2023, in Astronomical Society of the Pacific Conference Series, 534, Protostars and Planets VII, eds. S. Inutsuka, Y. Aikawa, T. Muto, K. Tomida, & M. Tamura, 465 [Google Scholar]
- Lienert, J. L., Bitsch, B., & Henning, T. 2024, A&A, 691, A72 [NASA ADS] [CrossRef] [EDP Sciences] [Google Scholar]
- Lienert, J. L., Bitsch, B., & Henning, T. 2025, A&A, 700, A67 [NASA ADS] [CrossRef] [EDP Sciences] [Google Scholar]
- Lodato, G., Dipierro, G., Ragusa, E., et al. 2019, MNRAS, 486, 453 [Google Scholar]
- Long, F., Pinilla, P., Herczeg, G. J., et al. 2018, ApJ, 869, 17 [Google Scholar]
- Lovelace, R. V. E., Li, H., Colgate, S. A., & Nelson, A. F. 1999, ApJ, 513, 805 [NASA ADS] [CrossRef] [Google Scholar]
- Lynden-Bell, D., & Pringle, J. E. 1974, MNRAS, 168, 603 [Google Scholar]
- Manara, C. F., Mordasini, C., Testi, L., et al. 2019, A&A, 631, L2 [NASA ADS] [CrossRef] [EDP Sciences] [Google Scholar]
- Manara, C. F., Ansdell, M., Rosotti, G. P., et al. 2023, in Astronomical Society of the Pacific Conference Series, 534, Protostars and Planets VII, eds. S. Inutsuka, Y. Aikawa, T. Muto, K. Tomida, & M. Tamura, 539 [Google Scholar]
- McNally, C. P., Nelson, R. P., Paardekooper, S.-J., & Benítez-Llambay, P. 2019, MNRAS, 484, 728 [Google Scholar]
- Müller-Horn, J., Pichierri, G., & Bitsch, B. 2022, A&A, 663, A163 [NASA ADS] [CrossRef] [EDP Sciences] [Google Scholar]
- Ndugu, N., Bitsch, B., & Lienert, J. L. 2024, A&A, 691, A32 [NASA ADS] [CrossRef] [EDP Sciences] [Google Scholar]
- O’Dell, C. R. 2001, ARA&A, 39, 99 [Google Scholar]
- Ormel, C. W., & Klahr, H. H. 2010, A&A, 520, A43 [NASA ADS] [CrossRef] [EDP Sciences] [Google Scholar]
- Ossenkopf, V., & Henning, T. 1994, A&A, 291, 943 [NASA ADS] [Google Scholar]
- Otter, J., Ginsburg, A., Ballering, N. P., et al. 2021, ApJ, 923, 221 [NASA ADS] [CrossRef] [Google Scholar]
- Owen, J. E., Ercolano, B., & Clarke, C. J. 2011, MNRAS, 412, 13 [Google Scholar]
- Paardekooper, S.-J., Baruteau, C., & Kley, W. 2011, MNRAS, 410, 293 [NASA ADS] [CrossRef] [Google Scholar]
- Padoan, P., Kritsuk, A., Norman, M. L., & Nordlund, Å. 2005, ApJ, 622, L61 [NASA ADS] [CrossRef] [Google Scholar]
- Pascucci, I., Cabrit, S., Edwards, S., et al. 2023, in Astronomical Society of the Pacific Conference Series, 534, Protostars and Planets VII, eds. S. Inutsuka, Y. Aikawa, T. Muto, K. Tomida, & M. Tamura, 567 [Google Scholar]
- Pascucci, I., Testi, L., Herczeg, G. J., et al. 2016, ApJ, 831, 125 [Google Scholar]
- Pfeil, T., & Klahr, H. 2021, ApJ, 915, 130 [NASA ADS] [CrossRef] [Google Scholar]
- Pichierri, G., Bitsch, B., & Lega, E. 2023, A&A, 670, A148 [NASA ADS] [CrossRef] [EDP Sciences] [Google Scholar]
- Pichierri, G., Bitsch, B., & Lega, E. 2024, ApJ, 967, 111 [NASA ADS] [CrossRef] [Google Scholar]
- Pichierri, G., Morbidelli, A., & Crida, A. 2018, Celest. Mech. Dyn. Astron., 130, 54 [Google Scholar]
- Picogna, G., Ercolano, B., Owen, J. E., & Weber, M. L. 2019, MNRAS, 487, 691 [Google Scholar]
- Pinilla, P., Birnstiel, T., Ricci, L., et al. 2012, A&A, 538, A114 [NASA ADS] [CrossRef] [EDP Sciences] [Google Scholar]
- Pinte, C., Dent, W. R. F., Ménard, F., et al. 2016, ApJ, 816, 25 [Google Scholar]
- Rafikov, R. R. 2015, ApJ, 804, 62 [Google Scholar]
- Rafikov, R. R. 2017, ApJ, 837, 163 [NASA ADS] [CrossRef] [Google Scholar]
- Ramírez-Tannus, M. C., Bik, A., Cuijpers, L., et al. 2023, ApJ, 958, L30 [CrossRef] [Google Scholar]
- Ramírez-Tannus, M. C., Bik, A., Getman, K. V., et al. 2025, A&A, 701, A139 [NASA ADS] [CrossRef] [EDP Sciences] [Google Scholar]
- Riols, A., & Lesur, G. 2019, A&A, 625, A108 [NASA ADS] [CrossRef] [EDP Sciences] [Google Scholar]
- Riols, A., Lesur, G., & Menard, F. 2020, A&A, 639, A95 [NASA ADS] [CrossRef] [EDP Sciences] [Google Scholar]
- Rosotti, G. P. 2023, New A Rev., 96, 101674 [NASA ADS] [CrossRef] [Google Scholar]
- Sano, T., & Stone, J. M. 2002, ApJ, 577, 534 [NASA ADS] [CrossRef] [Google Scholar]
- Sellek, A. D., Booth, R. A., & Clarke, C. J. 2020, MNRAS, 492, 1279 [NASA ADS] [CrossRef] [Google Scholar]
- Shakura, N. I., & Sunyaev, R. A. 1973, A&A, 24, 337 [NASA ADS] [Google Scholar]
- Somigliana, A., Testi, L., Rosotti, G., et al. 2023, ApJ, 954, L13 [NASA ADS] [CrossRef] [Google Scholar]
- Stoll, M. H. R., & Kley, W. 2014, A&A, 572, A77 [NASA ADS] [CrossRef] [EDP Sciences] [Google Scholar]
- Störzer, H., & Hollenbach, D. 1999, ApJ, 515, 669 [CrossRef] [Google Scholar]
- Suriano, S. S., Li, Z.-Y., Krasnopolsky, R., & Shang, H. 2017, MNRAS, 468, 3850 [NASA ADS] [CrossRef] [Google Scholar]
- Suriano, S. S., Li, Z.-Y., Krasnopolsky, R., Suzuki, T. K., & Shang, H. 2019, MNRAS, 484, 107 [NASA ADS] [CrossRef] [Google Scholar]
- Suzuki, T. K., & Inutsuka, S.-i. 2009, ApJ, 691, L49 [NASA ADS] [CrossRef] [Google Scholar]
- Suzuki, T. K., Ogihara, M., Morbidelli, A., Crida, A., & Guillot, T. 2016, A&A, 596, A74 [NASA ADS] [CrossRef] [EDP Sciences] [Google Scholar]
- Tabone, B., Rosotti, G. P., Cridland, A. J., Armitage, P. J., & Lodato, G. 2022a, MNRAS, 512, 2290 [NASA ADS] [CrossRef] [Google Scholar]
- Tabone, B., Rosotti, G. P., Lodato, G., et al. 2022b, MNRAS, 512, L74 [NASA ADS] [CrossRef] [Google Scholar]
- Tabone, B., Rosotti, G. P., Trapman, L., et al. 2025, ApJ, 989, 7 [Google Scholar]
- Tanaka, H., Himeno, Y., & Ida, S. 2005, ApJ, 625, 414 [NASA ADS] [CrossRef] [Google Scholar]
- Tazzari, M., Testi, L., Natta, A., et al. 2021, MNRAS, 506, 5117 [NASA ADS] [CrossRef] [Google Scholar]
- Terquem, C., & Papaloizou, J. C. B. 2007, ApJ, 654, 1110 [Google Scholar]
- Testi, L., Birnstiel, T., Ricci, L., et al. 2014, in Protostars and Planets VI, eds. H. Beuther, R. S. Klessen, C. P. Dullemond, & T. Henning, 339 [Google Scholar]
- Throop, H. B., & Bally, J. 2008, AJ, 135, 2380 [NASA ADS] [CrossRef] [Google Scholar]
- Trapman, L., Rosotti, G., Zhang, K., & Tabone, B. 2023, ApJ, 954, 41 [NASA ADS] [CrossRef] [Google Scholar]
- Turner, N. J., Fromang, S., Gammie, C., et al. 2014, in Protostars and Planets VI, eds. H. Beuther, R. S. Klessen, C. P. Dullemond, & T. Henning, 411 [Google Scholar]
- Tzouvanou, A., Bitsch, B., & Pichierri, G. 2023, A&A, 677, A82 [NASA ADS] [CrossRef] [EDP Sciences] [Google Scholar]
- Urpin, V., & Brandenburg, A. 1998, MNRAS, 294, 399 [Google Scholar]
- Velikhov, E. P. 1959, Sov. J. Exp. Theor. Phys., 9, 995 [NASA ADS] [Google Scholar]
- Villenave, M., Stapelfeldt, K. R., Duchêne, G., et al. 2022, ApJ, 930, 11 [NASA ADS] [CrossRef] [Google Scholar]
- Vioque, M., Kurtovic, N. T., Trapman, L., et al. 2025, ApJ, 989, 9 [Google Scholar]
- Wardle, M., & Koenigl, A. 1993, ApJ, 410, 218 [Google Scholar]
- Weder, J., Mordasini, C., & Emsenhuber, A. 2023, A&A, 674, A165 [NASA ADS] [CrossRef] [EDP Sciences] [Google Scholar]
- Weber, M. L., Sarafidou, E., Rab, C., Gressel, O., & Ercolano, B. 2025, A&A, 704, A197 [NASA ADS] [CrossRef] [EDP Sciences] [Google Scholar]
- Weder, J., Winter, A. J., & Mordasini, C. 2026, A&A, 705, A102 [NASA ADS] [CrossRef] [EDP Sciences] [Google Scholar]
- Weidenschilling, S. J. 1977, MNRAS, 180, 57 [Google Scholar]
- Whipple, F. L. 1972, in From Plasma to Planet, ed. A. Elvius, 211 [Google Scholar]
- Winter, A. J., & Haworth, T. J. 2022, Eur. Phys. J. Plus, 137, 1132 [NASA ADS] [CrossRef] [Google Scholar]
- Winter, A. J., Clarke, C. J., Rosotti, G., et al. 2018, MNRAS, 478, 2700 [Google Scholar]
- Winter, A. J., Clarke, C. J., Rosotti, G. P., Hacar, A., & Alexander, R. 2019, MNRAS, 490, 5478 [NASA ADS] [CrossRef] [Google Scholar]
- Winter, A. J., Benisty, M., Manara, C. F., & Gupta, A. 2024, A&A, 691, A169 [NASA ADS] [CrossRef] [EDP Sciences] [Google Scholar]
- Youdin, A. N., & Goodman, J. 2005, ApJ, 620, 459 [Google Scholar]
- Youdin, A. N., & Lithwick, Y. 2007, Icarus, 192, 588 [NASA ADS] [CrossRef] [Google Scholar]
- Zagaria, F., Rosotti, G. P., Clarke, C. J., & Tabone, B. 2022, MNRAS, 514, 1088 [CrossRef] [Google Scholar]
- Zallio, L., Rosotti, G., Tabone, B., et al. 2024, A&A, 692, A93 [NASA ADS] [CrossRef] [EDP Sciences] [Google Scholar]
- Zhang, K., Pérez, L. M., Pascucci, I., et al. 2025, ApJ, 989, 1 [Google Scholar]
These α parameters effectively measure stress-to-pressure ratios, with the explicit definitions (Tabone et al. 2022a)
![Mathematical equation: $\[\alpha_{\mathrm{SS}}:=\frac{2}{3} \frac{\int_{-H_{\mathrm{DW}}}^{+H_{\mathrm{DW}}} T_{r \phi} \mathrm{~d} z}{\Sigma_{\mathrm{g}} c_{\mathrm{s}}^2}, \quad \alpha_{\mathrm{DW}}:=\frac{4}{3} \frac{r\left[T_{z \phi}\right]_{-H_{\mathrm{DW}}}^{+H_{\mathrm{DW}}}}{\Sigma_{\mathrm{g}} c_{\mathrm{s}}^2},\]$](/articles/aa/full_html/2026/03/aa58535-25/aa58535-25-eq56.png)
where Trϕ and Tzϕ are the components of the (time-averaged) stress tensor associated to the radial and vertical transport of angular momentum, and HDW is the vertical scale height where the MHD wind is launched.
For completeness, we add the radius R90%,12CO that encloses 90% of the 12CO emission. This is calculated as the location where column density is below a critical value, inhibiting self-shielding and causing photo-dissociation, ![Mathematical equation: $\[N \approx 10^{21.27-0.53 ~\log \left(L_{*} / L_{\odot}\right)} \times\left(\frac{M_{\mathrm{g}}}{M_{\odot}}\right)^{0.3-0.08 ~\log \left(L_{*} / L_{\odot}\right)} \mathrm{cm}^{-2}\]$](/articles/aa/full_html/2026/03/aa58535-25/aa58535-25-eq57.png) (Trapman et al. 2023; see also Anania et al. 2025a).
(Trapman et al. 2023; see also Anania et al. 2025a).
Appendix A Comparison of photoevaporative models
For honest comparison with previous works that used the original FRIED grid of Haworth et al. (2018) (FRIEDv1), we show the outcome of a few setups with the original grid and with the updated version from Haworth et al. (2023) (FRIEDv2) we have used throughout the paper. The differences in the mass-loss rates arise from uncertainties in the wind microphysics, specifically the PAH-to-gas ratio fPAH (more conservative in the original FRIED grid), the UV cross section of the wind (larger by about a factor 2 in the FRIEDv2 grid), and the dust-to-gas mass ratio in the wind (lower by a factor 3 in the updated grid), see Sect. 4 of Haworth et al. (2023). The left panel of Figure A.1 shows the surface density evolution for purely viscous discs with αSS = 10−3, Rc = 100 AU and an FUV flux of 1000 G0, using the FRIEDv1 and FRIEDv2 grids. The right panel shows the dust mass fraction removed by the FUV-driven wind for different values of αSS and FUV fluxes (see Figure 8 of Sellek et al. 2020) with the two different FRIED grids. There are some minor differences in the surface density evolution, specifically in the disc truncation radii (see Subsect. 2.2 for the definition), but only by a factor of about a few. The main difference is in fPE.wind, which can vary by up to one order of magnitude for the lowest FUV fluxes, with the updated FRIED grid yielding (for the fiducial fPAH = 1 value) consistently lower fPE.wind. This shows that the outer disc microphysics may have some impact on the dust reservoirs in the inner discs (see also Coleman et al. 2025). While there is no FRIEDv2 analogue of the original FRIED grid tables, we investigate different fPAH values in a separate paper (Pichierri et al. in prep.).
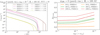 |
Fig. A.1 Comparison of identical setups using the fiducial original FRIED grid (FRIEDv2) vs. the fiducial FRIEDv2 for the photoevaporative mass loss, in the case of purely viscous discs. Left panel: Surface density evolution, for given αSS and FUV field. Right panel: Fraction of dust mass loss to the wind for various αSS and FUV fields. |
Appendix B Dust entrainment in MHD winds and role of radial drift
We check that ignoring dust entrainment and removal through the MHD disc wind does not lead to significant differences to our results. The efficiency of this mechanism depends both on the ability of dust to be delivered to the wind and the ability of the wind to carry away dust of a given size. We follow Booth & Clarke (2021), which found that the former process is typically the limiting factor to dust removal, and that delivery of small grains to the wind base is induced by advection rather than turbulent diffusion. Using the results of Giacalone et al. (2019) on the maximum size of dust than can be entrained by the MHD wind gives rather similar results within a factor of a few. Since the maximum grain size entrained scales with the local gas mass-loss rate, from Eq. (4) the biggest difference in our case would occur for small discs with high ψDW and high αDW; the mass-loss rate could in principle be higher than in our fiducial λ = 3 if one assumes the extreme value λ = 1.5, but the difference would only be of a factor of 4. Figure B.1 shows a comparison in dust evolution for the representative limit cases of ψDW = αDW = 0.01, Rc = 10 AU and λ = 3 (top row), spanning different FUV fluxes. Only up to a few percent of the initial dust mass is removed by the MHD wind, which lowers the amount of dust accreted onto the star only slightly, but ultimately makes very little difference in the amount of mass removed by the external FUV wind, the evolution of total dust mass in the disc, and therefore the dust lifetime diagnostic tdep,dust. Even considering the most extreme λ = 1.5 (bottom row), the dust removed by the MHD wind consists at most of ~ 10% of the initial dust mass, which modifies the amount of dust that reaches the star by a small amount (see top plot which uses a linear vertical scale for clarity), but does not impact fPE.wind or the total dust evolution significantly.
We end this appendix by showing in Figure B.2 how dust radial drift plays a decisive role in determining dust related diagnostics tdep,dust and fPE.wind. While the evolution of the gas and the mass-loss rates are indistinguishable, the lack of radial drift severely impacts the dust lifetime and the amount of dust removed by the photoevaporative wind.
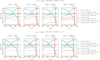 |
Fig. B.1 Evolution of the dust components in models including (thick dashed lines) or not including (thin continuous lines) dust entrainment and removal in MHD winds. Top panel: We consider the subset of the disc parameters used in this paper that would be most affected by MHD-wind dust entrainment, namely ψDW ≫ 1 (MHD-wind discs), high αtot = αDW = 0.01, low Rc = 10 AU, our fiducial λ = 3, and various FUV fluxes. We plot the evolution of the total dust mass, and the evolution of the dust mass lost to the photoevaporative wind, to the MHD wind and to the star (see second row of Fig. 3). A top inset with a linear vertical axis scaling is added to better display the very small differences that would otherwise be undetectable. Bottom panel: Same disc setups but with λ = 1.5, where MHD-wind-driven mass removal is most effective. Again, even in this extreme case, adding MHD-wind dust entrainment modifies only slightly the dust evolution and only affects the amount of dust accreted onto the star by a marginal amount (only visible in the top inset with linear vertical axis scaling). |
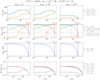 |
Fig. B.2 Results for a setup including (dashed lines) and not including (continuous lines) dust radial drift. The top three rows plot the same quantities as in Fig. 3, with different columns corresponding to different ψDW = αDW/αSS. We add the mass accretion rates as a bottom row (see Fig. 1). |
Appendix C Single-fluid equations
We report for completeness the exact gas and dust evolution equations that are actually solved by the code (a version of the DiscEvolution code described in Booth et al. 2017). Numerically, we evolve the total surface density Σtot = Σg + ∑k Σd,k solving an advection-diffusion equation with sink:
![Mathematical equation: $\[\begin{aligned}\frac{\partial \Sigma_{\mathrm{tot}}}{\partial t} & -\frac{3}{r} \frac{\partial}{\partial r}\left[\frac{1}{r \Omega_{\mathrm{K}}} \frac{\partial}{\partial r}\left[\alpha_{\mathrm{SS}} c_{\mathrm{s}}^2 r^2 \Sigma_{\mathrm{tot}}\right]\right] \\& -\frac{3}{2 r} \frac{\partial}{\partial r}\left[\frac{1}{\Omega_{\mathrm{K}}} \alpha_{\mathrm{DW}} c_{\mathrm{s}}^2 \Sigma_{\mathrm{tot}}\right] \\& =s_{\mathrm{tot}} ;\end{aligned}\]$](/articles/aa/full_html/2026/03/aa58535-25/aa58535-25-eq50.png) (C.1)
(C.1)
the dust mass fractions ϵd,k = Σd,k/Σtot evolves as
![Mathematical equation: $\[\begin{aligned}\frac{D \epsilon_{\mathrm{d}, k}}{D t} & =-\frac{1}{\Sigma_{\mathrm{tot}} r} \frac{\partial}{\partial r}\left[r \Sigma_{\mathrm{tot}} \epsilon_{\mathrm{d}, k}\left(\Delta v_{\mathrm{d}, k}-\epsilon_{\mathrm{d}} \Delta v_{\mathrm{d}}\right)-r D_{\mathrm{d}, k} \Sigma_{\mathrm{tot}} \frac{\partial \epsilon_{\mathrm{d}, k}}{\partial r}\right] \\& +\epsilon_{\mathrm{d}, k}(\frac{s_{\mathrm{d}, k}}{\Sigma_{\mathrm{d}, k}}-\frac{s_{\mathrm{tot}}}{\Sigma_{\mathrm{tot}}}) .\end{aligned}\]$](/articles/aa/full_html/2026/03/aa58535-25/aa58535-25-eq51.png) (C.2)
(C.2)
In the equations above, stot := sg + ∑k sd,k represents the combined sink terms for gas and dust species, where in our case ![Mathematical equation: $\[s_{\mathrm{g}}=-\left(\dot{\Sigma}_{\mathrm{g}, \mathrm{DW}}+\dot{\Sigma}_{\mathrm{g}, \text {evap}}\right)\]$](/articles/aa/full_html/2026/03/aa58535-25/aa58535-25-eq52.png) , and
, and ![Mathematical equation: $\[s_{\mathrm{d}, k}=-\dot{\Sigma}_{\mathrm{d}, k, \text {evap}}\]$](/articles/aa/full_html/2026/03/aa58535-25/aa58535-25-eq53.png) (no dust is removed by MHD winds in our nominal simulations presented in the main text for simplicity, although see Appendix B, where a
(no dust is removed by MHD winds in our nominal simulations presented in the main text for simplicity, although see Appendix B, where a ![Mathematical equation: $\[-\dot{\Sigma}_{\mathrm{d}, \mathrm{DW}}\]$](/articles/aa/full_html/2026/03/aa58535-25/aa58535-25-eq54.png) term is included). Moreover,
term is included). Moreover, ![Mathematical equation: $\[\frac{D}{D t}=\frac{\partial}{\partial t}+v \cdot \nabla\]$](/articles/aa/full_html/2026/03/aa58535-25/aa58535-25-eq55.png) is the co-moving derivative with the barycentric velocity v of the different phases, Δvd,k is the relative velocity of the dust species k to the gas (which takes into account the backreaction of dust onto the gas, Tanaka et al. 2005; Bai & Stone 2010), and ϵdΔvd = ∑k ϵk Δvd,k. Following Laibe & Price (2014a,b) (see also Booth et al. 2017), this single-fluid approach is equivalent to a multi-fluid view of the problem.
is the co-moving derivative with the barycentric velocity v of the different phases, Δvd,k is the relative velocity of the dust species k to the gas (which takes into account the backreaction of dust onto the gas, Tanaka et al. 2005; Bai & Stone 2010), and ϵdΔvd = ∑k ϵk Δvd,k. Following Laibe & Price (2014a,b) (see also Booth et al. 2017), this single-fluid approach is equivalent to a multi-fluid view of the problem.
Appendix D Explicit dependence on total and relative α parameters
We show here an alternative visualisation of the data making Figures 5, 6, where the various diagnostics are plotted on the ψDW versus αtot plane (Figs. D.1 and D.3). This shows the regions of parameter space where the different disc lifetimes are above certain thresholds (1 Myr, 3.16 Myr and 10 Myr). We also show both fPE.wind and fstar on separate panels.
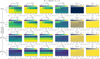 |
Fig. D.1 Similar to Fig. 5, but displaying the dependence on αtot in the vertical axes, so each diagnostic is shown via a heat map. The fraction of dust mass accreted onto the star is also shown as an additional column on the right. Regions of the ψDW versus αtot parameter space where the timescales are above given thresholds (1 Myr, 3.16 Myr and 10 Myr) are marked by dotted, dashed, and solid black lines (same scheme as Figs. 5, 6) |
All Tables
All Figures
|
Fig. 1 Mass accretion rates, photoevaporative mass loss rates, and MHD-wind-driven mass loss rates for discs of different initial sizes and with different values of ψDW, namely ψDW = 0 (purely viscous disc, dotted lines), ψDW = 1 (hybrid disc, dashed lines), and ψDW ≫ 1 (purely MHD-wind disc, continuous lines). For explanatory purposes we consider here high irradiation, 1000 G0, and low-to-moderate total αtot = 10−4–10−3. The vertical dashed purple lines represent the gas disc lifetime diagnostic tdep,gas (see Sect. 3.3). |
| In the text | |
|
Fig. 2 Mass-accretion rate vs. the mass-loss rate in the wind (either the photoevaporative wind alone – blue dots –, or combined with the MHD wind – red dots), obtained from mock observations at random times, selected randomly from a uniform distribution in the interval [0 My, 31.6 My]. Each panel shows the outcome of these experiments for different fixed underlying ψDW = αDW/αSS, while the initial disc sizes, total αtot, and (finite) FUV fluxes are drawn randomly (values from Table 1). |
| In the text | |
|
Fig. 3 Typical evolution of representative dust and gas quantities for either fully MHD-driven discs (continuous lines) or fully viscous discs (dashed lines), subjected to external photoevaporation, as a function of initial disc size Rc (different columns). Top row: dust radii R90%,d enclosing 90% of the dust mass and R90%,12CO, the radius that encloses 90% of the 12CO emission, calculated following Trapman et al. (2023). Upward triangles label the cases where the dust radii initially expand, while circles indicate those that do not, due to external irradiation. Middle row: time evolution of the total dust mass, mass accreted onto the star, and mass lost to wind. The vertical red lines denote the times when the dust mass reaches fraction of the initial mass (set to 1/1000). Bottom row: time evolution of the gas mass. Similarly to the dust, the vertical purple lines denote the times when the gas mass reaches 1/1000 of the initial mass. The underlying total αtot = 10−3 and the FUV flux is set to 1000 G0. |
| In the text | |
|
Fig. 4 Fraction of dust mass lost to wind as a function of the initial disc size, Rc, for different ψDW = αDW/αSS and αtot = αDW + αSS. |
| In the text | |
|
Fig. 5 Disc diagnostics as a function of ψDW = αDW/αSS for different total αtot = αDW + αSS (different colours and line styles, see legends in the last column) and for different FUV fluxes over different rows (see labels on the left along the arrow). In all cases, the disc’s initial size Rc = 100 AU. Upward pointing arrows at t = 31.6 My show that the data points represent lower bounds. First column: time when the total dust mass drops below 1/1000 of the initial dust mass (tdep,dus). Second column: time when the gas mass drops below 1/1000 of the initial gas mass (tdep,gas). Third column: Time at which the accretion rate onto the star drops below 10−11 M⊙/yr (tacc.). Fourth column: time when the disc would be undetectable due to lack of IR excess (tIR.ex); we estimate this as the time when the surface density of small dust at r = 1 AU drops below 1/κ0, with a reference opacity of small dust grains κ0 = 1000 cm2/g. Last column: fraction of dust mass lost to wind (note the somewhat inconsistent vertical axis range due to values spanning different orders of magnitude across the different setups; see also Fig. 4). As shown in the legend in the first and fourth columns (which relate to dust timescales), the upward triangles indicate runs where the dust disc radii initially expand due to significant diffusion, while circles indicate those setups that do not (see top row of Fig. 3). |
| In the text | |
|
Fig. 6 Same as Fig. 5, but for initially compact discs, Rc = 10 AU. Note again the somewhat inconsistent vertical axis range for the dust mass fraction removed by the external photoevaporative wind fPE.wind. |
| In the text | |
|
Fig. A.1 Comparison of identical setups using the fiducial original FRIED grid (FRIEDv2) vs. the fiducial FRIEDv2 for the photoevaporative mass loss, in the case of purely viscous discs. Left panel: Surface density evolution, for given αSS and FUV field. Right panel: Fraction of dust mass loss to the wind for various αSS and FUV fields. |
| In the text | |
|
Fig. B.1 Evolution of the dust components in models including (thick dashed lines) or not including (thin continuous lines) dust entrainment and removal in MHD winds. Top panel: We consider the subset of the disc parameters used in this paper that would be most affected by MHD-wind dust entrainment, namely ψDW ≫ 1 (MHD-wind discs), high αtot = αDW = 0.01, low Rc = 10 AU, our fiducial λ = 3, and various FUV fluxes. We plot the evolution of the total dust mass, and the evolution of the dust mass lost to the photoevaporative wind, to the MHD wind and to the star (see second row of Fig. 3). A top inset with a linear vertical axis scaling is added to better display the very small differences that would otherwise be undetectable. Bottom panel: Same disc setups but with λ = 1.5, where MHD-wind-driven mass removal is most effective. Again, even in this extreme case, adding MHD-wind dust entrainment modifies only slightly the dust evolution and only affects the amount of dust accreted onto the star by a marginal amount (only visible in the top inset with linear vertical axis scaling). |
| In the text | |
|
Fig. B.2 Results for a setup including (dashed lines) and not including (continuous lines) dust radial drift. The top three rows plot the same quantities as in Fig. 3, with different columns corresponding to different ψDW = αDW/αSS. We add the mass accretion rates as a bottom row (see Fig. 1). |
| In the text | |
|
Fig. D.1 Similar to Fig. 5, but displaying the dependence on αtot in the vertical axes, so each diagnostic is shown via a heat map. The fraction of dust mass accreted onto the star is also shown as an additional column on the right. Regions of the ψDW versus αtot parameter space where the timescales are above given thresholds (1 Myr, 3.16 Myr and 10 Myr) are marked by dotted, dashed, and solid black lines (same scheme as Figs. 5, 6) |
| In the text | |
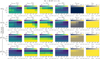 |
Fig. D.2 Same as Fig. D.1, but for initially less large discs, Rc = 30 AU. |
| In the text | |
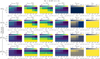 |
Fig. D.3 Same as Fig. D.1, but for initially compact discs, Rc = 10 AU (see also Fig. 6). |
| In the text | |
Current usage metrics show cumulative count of Article Views (full-text article views including HTML views, PDF and ePub downloads, according to the available data) and Abstracts Views on Vision4Press platform.
Data correspond to usage on the plateform after 2015. The current usage metrics is available 48-96 hours after online publication and is updated daily on week days.
Initial download of the metrics may take a while.