Fig. 2
Download original image
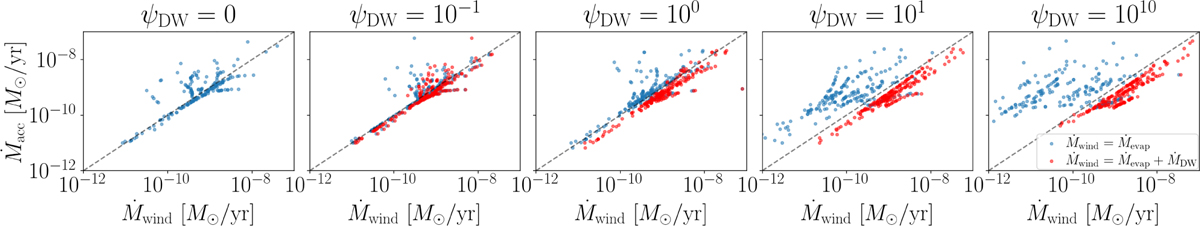
Mass-accretion rate vs. the mass-loss rate in the wind (either the photoevaporative wind alone – blue dots –, or combined with the MHD wind – red dots), obtained from mock observations at random times, selected randomly from a uniform distribution in the interval [0 My, 31.6 My]. Each panel shows the outcome of these experiments for different fixed underlying ψDW = αDW/αSS, while the initial disc sizes, total αtot, and (finite) FUV fluxes are drawn randomly (values from Table 1).
Current usage metrics show cumulative count of Article Views (full-text article views including HTML views, PDF and ePub downloads, according to the available data) and Abstracts Views on Vision4Press platform.
Data correspond to usage on the plateform after 2015. The current usage metrics is available 48-96 hours after online publication and is updated daily on week days.
Initial download of the metrics may take a while.