Fig. 3
Download original image
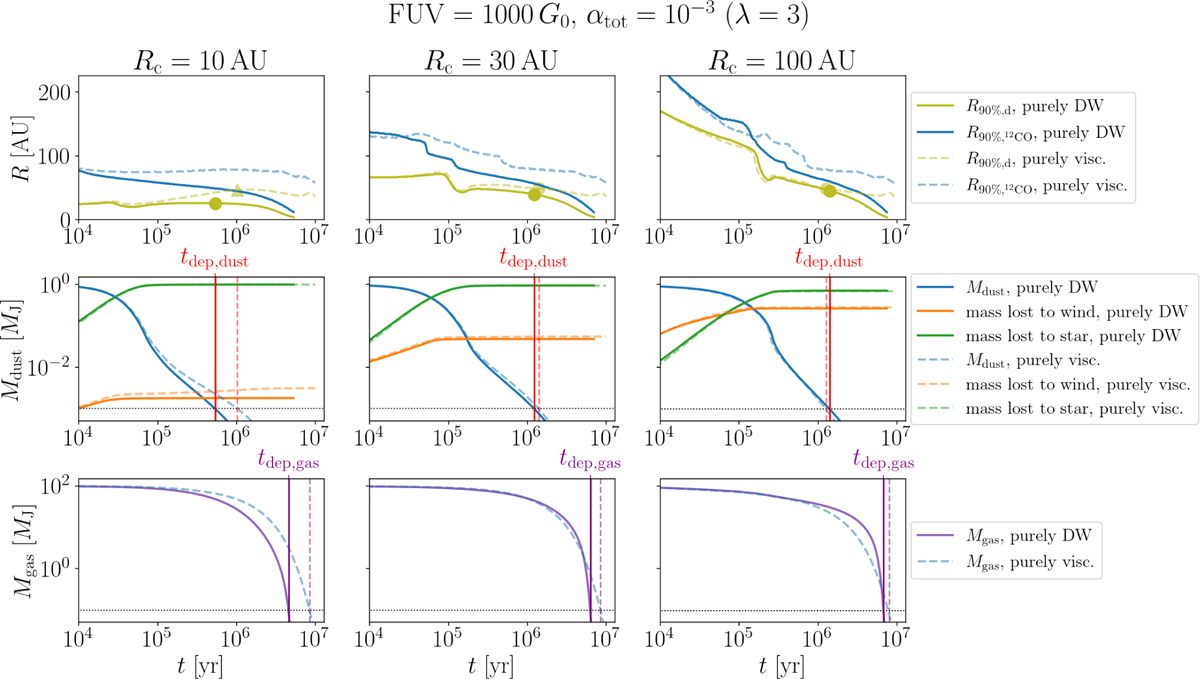
Typical evolution of representative dust and gas quantities for either fully MHD-driven discs (continuous lines) or fully viscous discs (dashed lines), subjected to external photoevaporation, as a function of initial disc size Rc (different columns). Top row: dust radii R90%,d enclosing 90% of the dust mass and R90%,12CO, the radius that encloses 90% of the 12CO emission, calculated following Trapman et al. (2023). Upward triangles label the cases where the dust radii initially expand, while circles indicate those that do not, due to external irradiation. Middle row: time evolution of the total dust mass, mass accreted onto the star, and mass lost to wind. The vertical red lines denote the times when the dust mass reaches fraction of the initial mass (set to 1/1000). Bottom row: time evolution of the gas mass. Similarly to the dust, the vertical purple lines denote the times when the gas mass reaches 1/1000 of the initial mass. The underlying total αtot = 10−3 and the FUV flux is set to 1000 G0.
Current usage metrics show cumulative count of Article Views (full-text article views including HTML views, PDF and ePub downloads, according to the available data) and Abstracts Views on Vision4Press platform.
Data correspond to usage on the plateform after 2015. The current usage metrics is available 48-96 hours after online publication and is updated daily on week days.
Initial download of the metrics may take a while.