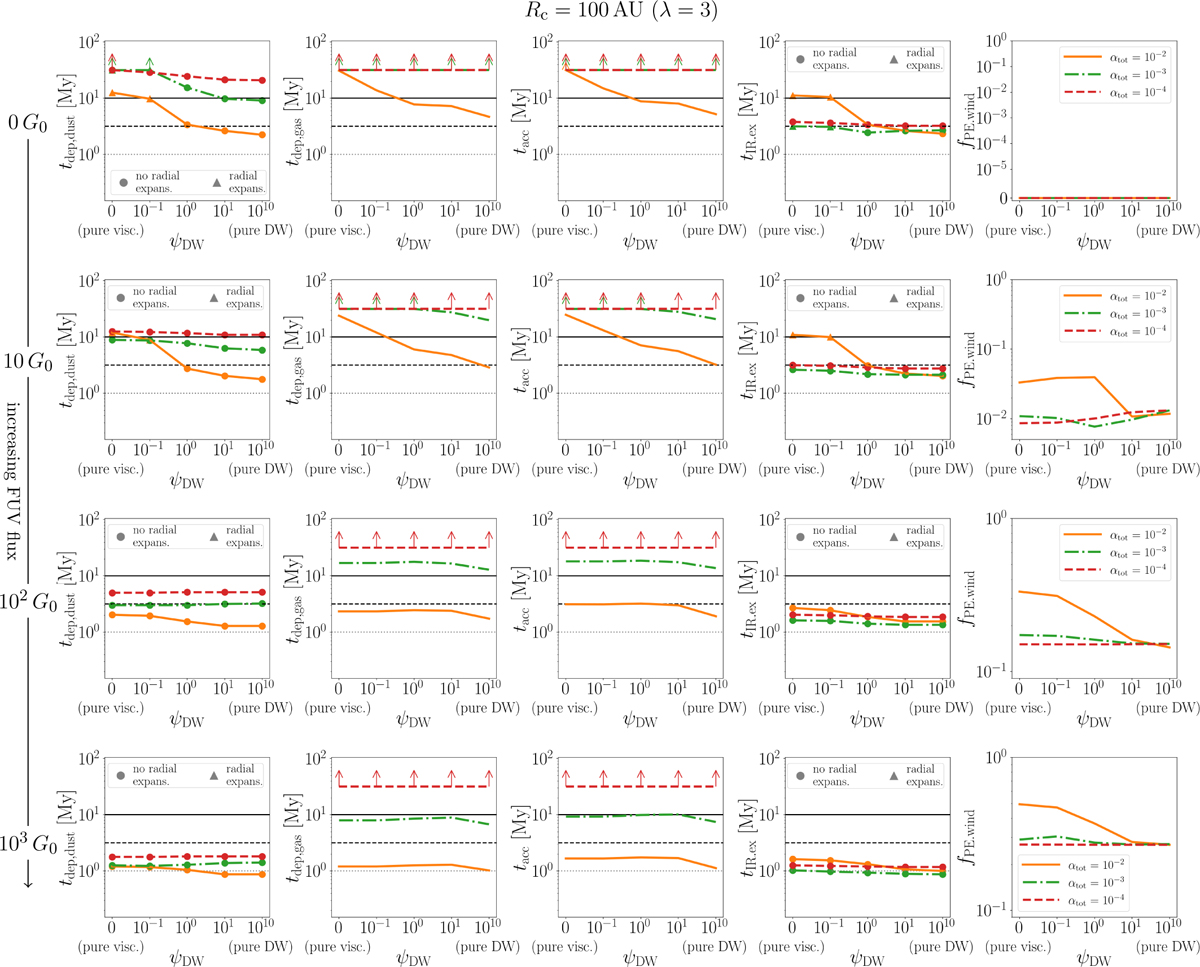
Fig. 5
Download original image
Disc diagnostics as a function of ψDW = αDW/αSS for different total αtot = αDW + αSS (different colours and line styles, see legends in the last column) and for different FUV fluxes over different rows (see labels on the left along the arrow). In all cases, the disc’s initial size Rc = 100 AU. Upward pointing arrows at t = 31.6 My show that the data points represent lower bounds. First column: time when the total dust mass drops below 1/1000 of the initial dust mass (tdep,dus). Second column: time when the gas mass drops below 1/1000 of the initial gas mass (tdep,gas). Third column: Time at which the accretion rate onto the star drops below 10−11 M⊙/yr (tacc.). Fourth column: time when the disc would be undetectable due to lack of IR excess (tIR.ex); we estimate this as the time when the surface density of small dust at r = 1 AU drops below 1/κ0, with a reference opacity of small dust grains κ0 = 1000 cm2/g. Last column: fraction of dust mass lost to wind (note the somewhat inconsistent vertical axis range due to values spanning different orders of magnitude across the different setups; see also Fig. 4). As shown in the legend in the first and fourth columns (which relate to dust timescales), the upward triangles indicate runs where the dust disc radii initially expand due to significant diffusion, while circles indicate those setups that do not (see top row of Fig. 3).
Current usage metrics show cumulative count of Article Views (full-text article views including HTML views, PDF and ePub downloads, according to the available data) and Abstracts Views on Vision4Press platform.
Data correspond to usage on the plateform after 2015. The current usage metrics is available 48-96 hours after online publication and is updated daily on week days.
Initial download of the metrics may take a while.