Open Access
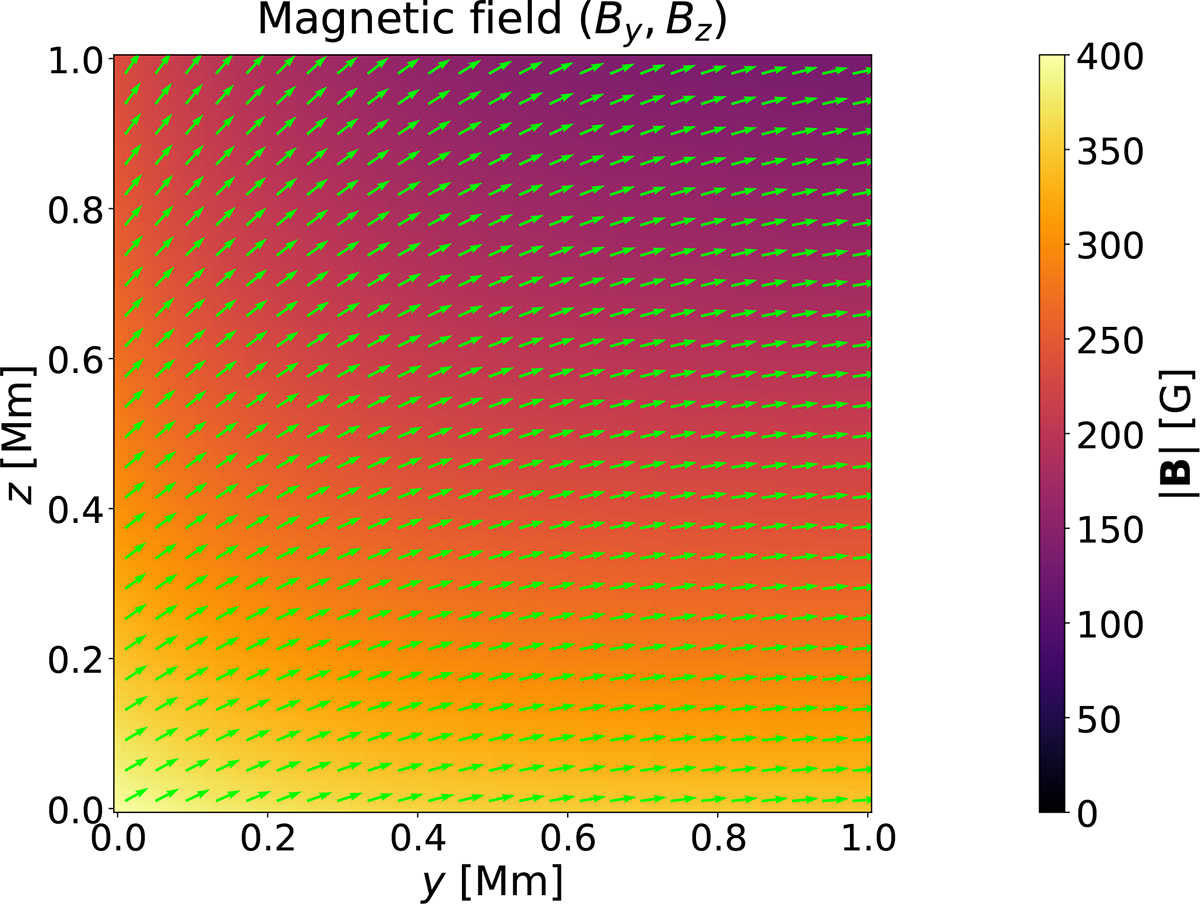
Fig. 3.
Download original image
Two-dimensional analytical magnetic field. The color map shows the magnitude of the magnetic field ∥B∥. The green arrows show its direction. The color bar is saturated at 400 G to show the lower values of the magnetic field. The maximum value of the magnetic field at the selected region is ≈415 G.
Current usage metrics show cumulative count of Article Views (full-text article views including HTML views, PDF and ePub downloads, according to the available data) and Abstracts Views on Vision4Press platform.
Data correspond to usage on the plateform after 2015. The current usage metrics is available 48-96 hours after online publication and is updated daily on week days.
Initial download of the metrics may take a while.