Open Access
Fig. 5.
Download original image
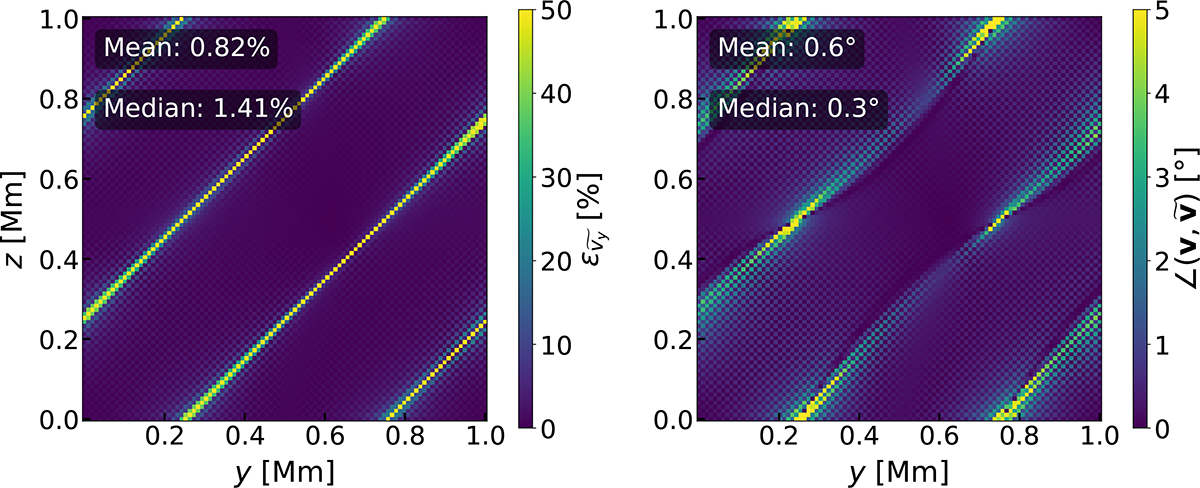
Errors of the inference of ![]() in the analytical 2D case. The left panel shows the relative error,
in the analytical 2D case. The left panel shows the relative error, ![]() , of the inferred velocity. The right panel shows the angle between the analytical velocity (v) and the inferred one (
, of the inferred velocity. The right panel shows the angle between the analytical velocity (v) and the inferred one (![]() ). See text for more details. Both plots also indicate the mean and the median of these errors.
). See text for more details. Both plots also indicate the mean and the median of these errors.
Current usage metrics show cumulative count of Article Views (full-text article views including HTML views, PDF and ePub downloads, according to the available data) and Abstracts Views on Vision4Press platform.
Data correspond to usage on the plateform after 2015. The current usage metrics is available 48-96 hours after online publication and is updated daily on week days.
Initial download of the metrics may take a while.