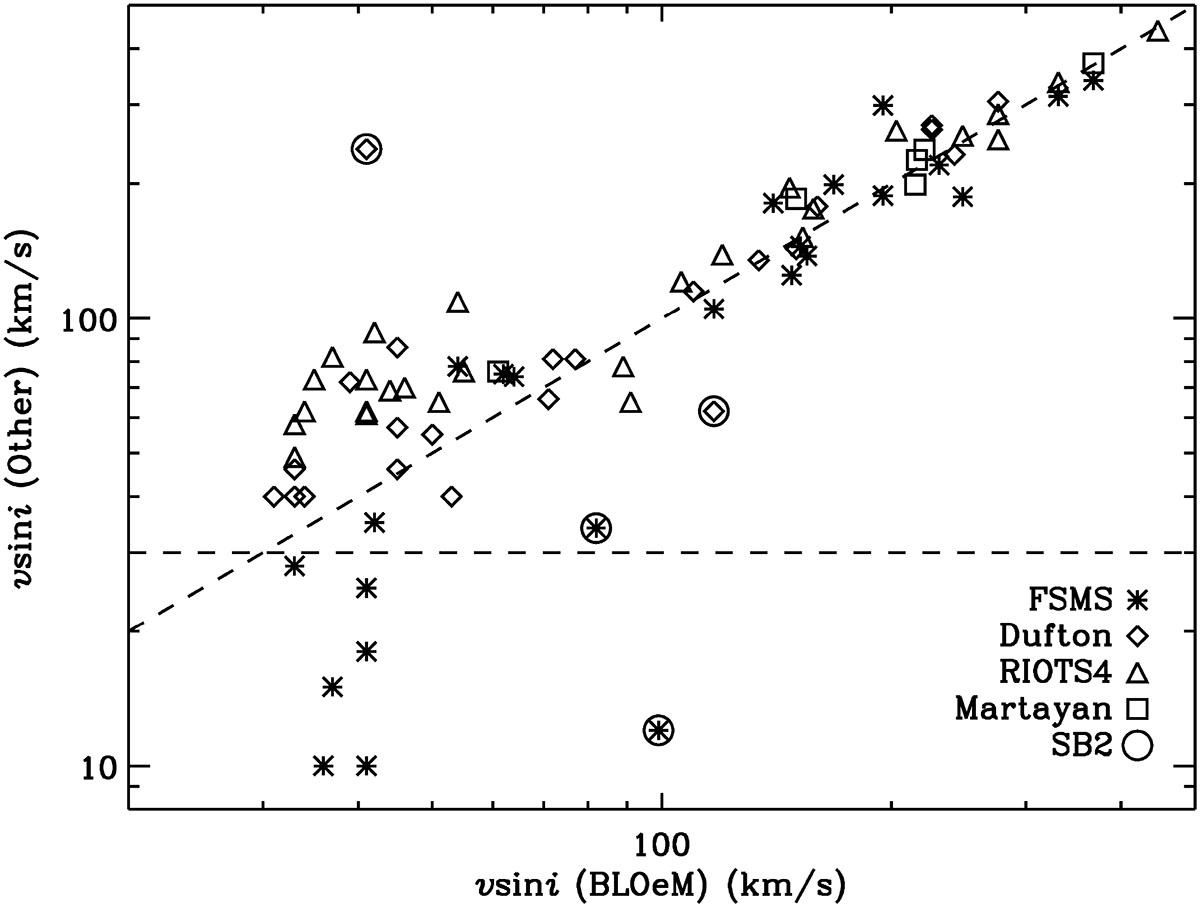
Fig. 12.
Download original image
Comparison of this work with v sin i values in the literature, as noted in the inset and described in Sect. 5, where references can also be found. The outliers in this plot are known SB2 systems (circled). The diagonal dashed line indicates the 1:1 correlation, and the horizontal line indicates the approximate lower limit of the BLOeM measurements.
Current usage metrics show cumulative count of Article Views (full-text article views including HTML views, PDF and ePub downloads, according to the available data) and Abstracts Views on Vision4Press platform.
Data correspond to usage on the plateform after 2015. The current usage metrics is available 48-96 hours after online publication and is updated daily on week days.
Initial download of the metrics may take a while.