| Issue |
A&A
Volume 707, March 2026
|
|
|---|---|---|
| Article Number | A204 | |
| Number of page(s) | 15 | |
| Section | Stellar structure and evolution | |
| DOI | https://doi.org/10.1051/0004-6361/202558539 | |
| Published online | 05 March 2026 | |
Binarity at LOw Metallicity (BLOeM)
Projected rotational velocities★
1
Instituto de Astrofísica de Canarias, C. Vía Láctea s/n 38205 La Laguna Santa Cruz de Tenerife, Spain
2
Universidad de La Laguna, Dpto. Astrofísica, Av. Astrofśico Francisco Sánchez 38206 La Laguna Santa Cruz de Tenerife, Spain
3
Centro de Astrobiologìa (CSIC–INTA), Camino Bajo del Castillo s/n E-28692 Villanueva de la Cañada Madrid, Spain
4
Royal Observatory of Belgium Avenue Circulaire/Ringlaan 3 B-1180 Brussels, Belgium
5
Astrophysics Research Centre, School of Mathematics & Physics, Queen’s University Belfast BT7 1NN, UK
6
Argelander-Institut für Astronomie, Universität Bonn Auf dem Hügel 71 53121 Bonn, Germany
7
Max-Planck-Institute for Astrophysics Karl-Schwarzschild-Strasse 1 85748 Garching, Germany
8
Department of Astronomy, Pupin Hall, 538 West 120th Street Columbia University New York City NY 10027, USA
9
Astrophysics Research Cluster, School of Mathematical & Physical Sciences, University of Sheffield, Hicks Building Hounsfield Road Sheffield S3 7RH, UK
10
School of Chemical, Materials and Biological Engineering, University of Sheffield, Sir Robert Hadfield Building Mappin Street Sheffield S1 3JD, UK
11
Armagh Observatory, College Hill Armagh BT61 9DG Northern Ireland, UK
12
Anton Pannekoek Institute for Astronomy, University of Amsterdam Science Park 904 1098 XH Amsterdam, The Netherlands
13
The School of Physics and Astronomy, Tel Aviv University Tel Aviv 6997801, Israel
14
Institute of Astronomy, KU Leuven Celestijnenlaan 200D 3001 Leuven, Belgium
15
Max-Planck-Institut für Astronomie Königstuhl 17 D-69117 Heidelberg, Germany
16
Centro de Astrobiología (CSIC-INTA) Ctra. Torrejón a Ajalvir km 4 28850 Torrejón de Ardoz, Spain
17
School of Mathematics, Statistics and Physics, Newcastle University Newcastle upon Tyne NE1 7RU, UK
18
School of Physics and Astronomy, Monash University Clayton VIC 3800, Australia
19
Australian Research Council Centre of Excellence for Gravitational Wave Discovery Clayton VIC 3800, Australia
20
European Space Agency (ESA), ESA Office, Space Telescope Science Institute 3700 San Martin Drive Baltimore MD 21218, USA
21
The Observatories of the Carnegie Institution for Science 813 Santa Barbara Street Pasadena CA 91101, USA
22
Department of Astronomy, California Institute of Technology Pasadena CA 91125, USA
23
Astronomical Institute, Academy of Sciences of the Czech Republic Fričova 298 CZ-251 65 Ondřejov, Czech Republic
24
Sterrenkundig Observatorium, Universiteit Gent Krijgslaan 281 S9 9000 Gent, Belgium
25
Lund Observatory, Division of Astrophysics, Department of Physics, Lund University Box 43 SE-221 00 Lund, Sweden
26
Department of Astronomy & Steward Observatory 933 N. Cherry Ave. Tucson AZ 85721, USA
27
Laboratório Nacional de Astrofísica Rua Estados Unidos 154 37504-364 Itajubá MG, Brazil
28
Zentrum für Astronomie der Universität Heidelberg, Astronomisches Rechen-Institut Mönchhofstr. 12-14 69120, Heidelberg
29
Interdisziplinäres Zentrum für Wissenschaftliches Rechnen, Universität Heidelberg Im Neuenheimer Feld 225 69120 Heidelberg, Germany
30
School of Astronomy and Space Science, Nanjing University Nanjing 210023, PR China
31
Key Laboratory of Modern Astronomy and Astrophysics, Nanjing University, Ministry of Education Nanjing 210023, PR China
32
Tsung-Dao Lee Institute, Shanghai Jiao-Tong University 1 Lisuo Road Shanghai 201210, PR China
★★ Corresponding author: This email address is being protected from spambots. You need JavaScript enabled to view it.
Received:
12
December
2025
Accepted:
25
January
2026
Abstract
The Binarity at LOw Metallicity (BLOeM) survey is an ESO large programme designed to obtain multi-epoch spectroscopy for 929 massive stars in the Small Magellanic Cloud (SMC). It will provide binary fractions and orbital configurations of binary systems and search for dormant black hole binary candidates (OB+BH). We present projected rotational velocities (v sin i) of all sources, and, using the multiplicity properties presented in previous papers, we derive the v sin i distributions of apparent single stars, single-lined spectroscopic (SB1) binaries, and SB2 systems. We identify a locus in the Hertzsprung-Russell diagram where rotational velocities decrease significantly; we interpret this feature as broadly corresponding to the terminal-age main sequence. The main-sequence cohort is distinguished by a broad range of v sin i values, but with a strong peak in the distribution in the range 30–60 km s−1, which is close to the resolution limit of ∼30 km s−1, indicating the presence of many upper limits. Sources in this low v sin i peak are distributed throughout the main sequence and are also present in the SB1 sample, though less prominent than in the single-star distribution. A preliminary analysis of the lowest v sin i cohort, which includes SB1 systems, implies that roughly one-third may be nitrogen rich, and we speculate that this cohort is a mix of pristine single stars, long-period binaries, and merger products. The SB2 systems appear to be mostly short-period binaries in synchronous rotation, and their v sin i estimates are distributed around a mean value of ∼140 km s−1. Higher v sin i sources are also present in the single and SB1 systems, all of which have a tail to higher v sin i values. This is consistent with tidal and mass-transfer effects. The supergiants, with a few exceptions, have low v sin i, and the bulk of these systems is essentially unresolved at the current spectral resolution (∼30 km s−1).
Key words: binaries: spectroscopic / stars: early-type / stars: evolution / stars: massive / stars: rotation / Magellanic Clouds
Based on observations collected at the European Southern Observatory under ESO program ID 112.25R7.
© The Authors 2026
 Open Access article, published by EDP Sciences, under the terms of the Creative Commons Attribution License (https://creativecommons.org/licenses/by/4.0), which permits unrestricted use, distribution, and reproduction in any medium, provided the original work is properly cited.
This article is published in open access under the Subscribe to Open model. This email address is being protected from spambots. You need JavaScript enabled to view it. to support open access publication.
1. Introduction
In the massive star domain (M* ≳ 8 M⊙), rotational mixing can have important consequences for a star’s evolution (Maeder & Meynet 2000), its surface composition (Hunter et al. 2008a, 2009; Bouret et al. 2013; Jin et al. 2024), its final endpoint as a supernova (SN) explosion or gamma-ray burst (GRB; Yoon & Langer 2005; Groh et al. 2013), and their remnants (Hirschi et al. 2025). The distribution of the rotation speeds of young massive stars can provide clues on the star formation process (Ramírez-Agudelo et al. 2013; Bastian et al. 2020; Britavskiy et al. 2023) or constrain the mode of star formation in a given environment (Wolff et al. 2006). The rotation speed can also be used as a diagnostic for a variety of processes, for example, mass transfer in binary evolution (de Mink et al. 2013), as a possible indicator of a previous stellar merger (Schneider et al. 2019; Frost et al. 2024), to determine the presence of magnetic fields (Ud-Doula et al. 2009; Fossati et al. 2015; Petit et al. 2019), or as a constraint on the history of runaway stars ejected as a result of a SN explosion (Renzo et al. 2019; Sana et al. 2022). Binary population synthesis also predicts how the distribution of rotational speeds evolves, which provides interesting predictions for the rotation velocities to be expected for products such as X-ray quiet OB+BH binaries (Xu et al. 2025; Schürmann et al. 2025). Therefore, the distribution of rotation speeds of massive stars is of fundamental importance for understanding their formation and evolution.
Howarth (2004) reviewed early work on the projected rotational velocities (v sin i) of massive stars in the Milky Way, while more recent studies focused on the v sin i distributions of OB stars (e.g. Berlanas et al. 2025; Holgado et al. 2022; Huang & Gies 2006; Bragança et al. 2012) and B-type supergiants (e.g. Fraser et al. 2010; de Burgos et al. 2023). The lower metallicity (Z) of the Magellanic Clouds offers an opportunity to examine the effect of Z on v sin i distributions, and several such studies already exist (examples include Mokiem et al. 2006; Martayan et al. 2007; Hunter et al. 2008b; Penny & Gies 2009; Dufton et al. 2013; Ramírez-Agudelo et al. 2013; Dufton et al. 2019; Ramachandran et al. 2019; Dorigo Jones et al. 2020; Bodensteiner et al. 2023).
We derive v sin i estimates of the 929 massive stars in the Small Magellanic Cloud (SMC) that have been observed by the survey called Binarity at LOw Metallicity (BLOeM) (Shenar et al. 2024). In addition to adding to the body of work that already exists for the SMC, two unique aspects of this survey are that its multi-epoch nature is tailored to detect and characterize binaries (see Shenar et al. 2024, for details), while the eight surveyed fields are distributed throughout the SMC bar and wing, as shown in Fig. 1. Bestenlehner et al. (2025) have presented preliminary stellar parameters for 778 BLOeM sources that also included v sin i estimates. Their v sin i estimates are based on profile fitting (a goodness-of-fit (GOF) method) using a discrete grid of v sin i values. However, their test results for a limited number of sources highlighted differences between the GOF and Fourier transform (FT) methods that were attributed to the FT approach being relatively insensitive to broadening effects that may include macroturbulence, intrinsic line breadth, and weak-line blending in binary systems. In this paper, we therefore extend the FT approach to the full BLOeM sample.
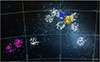 |
Fig. 1. Distribution of BLOeM targets (white circles) compared with those of some other major v sin i surveys: FSMS (Hunter et al. 2008b, orange), Martayan (Martayan et al. 2007, yellow), Ramachandran (Ramachandran et al. 2019, magenta), Dufton (Dufton et al. 2019, blue), and RIOTS4 (Dorigo Jones et al. 2020, cyan). |
2. Observational data
We used the BLOeM data release 4 (DR4) normalized spectra comprising 21 epochs for the eight fields, except for fields 4 and 8, which have 22 and 23 epochs, respectively. All epochs were merged to produce combined spectra for the analysis, and individual spectra were corrected for radial velocity shifts relative to combined nine-epoch DR3 spectra that were derived using the cross-correlation of the 4360–4560 Å region (see Patrick et al. 2025), and weighted by their observed counts. The multi-epoch nature of the combined spectra has some implications for the subsequent analysis. Spectroscopic binaries with a weak secondary spectrum (SB1 systems) for example are velocity shifted to the rest frame of their primary star, and hence, weak absorption lines of the secondary star may be smeared over the wings of the lines of the primary (see Fig. 2). Similarly, any line centroid shifts due to pulsation, such as β-Cepheid pulsation (see the review by Bowman 2020), can result in some smearing of the line profile. Double-lined spectroscopic binaries (SB2) present a particular problem, and our approach to these systems is described further in Sect. 3.
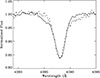 |
Fig. 2. Two He I 4387 Å line profiles for the source BLOeM 1-020, which is classified as an SB1 system and has a peak-to-peak velocity of ∼100 km s−1. The full and dashed lines show the profiles obtained at each quadrature. A faint secondary is visible on opposing sides of each profile. |
3. Method
The FT approach adopted here for the BLOeM sample has been widely discussed in the literature (see Sect. 5 for several applications to massive stars in nearby galaxies, while practical considerations for its application to hot stars have been discussed in detail by Simón-Díaz & Herrero (2007)). Briefly, the FT of the Unsöld-Struve rotational broadening function (see Collins & Truax 1995, for assumptions and limitations) is a Bessell function of the first kind that has zeros at positions that are characteristic of the rotational velocity and limb-darkening coefficient of the star (Carroll 1928, 1933). Formally, v sin i =x0/f0, where f0 is the position of the first minimum, and x0 is a constant depending on the limb-darkening coefficient α. In common with most comparable FT work in the literature, we adopted a limb-darkening coefficient of α = 0.6, the grey atmosphere solution, in the standard linear limb-darkening law (Gray 1976), implying that v sin i = 0.66/f0. Direct determination of α using model atmospheres (Howarth 2011; Reeve & Howarth 2016) demonstrates that α∼0.2–0.4 for main-sequence OB stars, and appropriate x0 values (see Collins & Truax 1995; Jankov 1995) then imply that v sin i estimates for these stars are overestimated by ∼5–3%, respectively. The median error of our results from other sources is ∼20%, and we therefore did not apply any corrections to our data. Furthermore, given the moderate resolving power of the BLOeM data of ∼7 000 and the effect of binaries on GOF results (discussed below), we primarily focus on rotational velocities here and ignore the potential effect of macroturbulence (see Ryans et al. 2002; Simón-Díaz & Herrero 2014; Simón-Díaz et al. 2017).
In the current approach, we derived the FT for a number of absorption lines for each BLOeM source. Their first minima yield separate v sin i measurements, the mean value of which yielded a measurement we refer to as v sin iFT. The choice of lines for a given star was dictated by a combination of signal-to-noise ratio (s/n), spectral type, and line width, resulting in three to ten lines that were identified per star. The strong He I lines (λλ 4143, 4387, 4471) were measured in all but a few of the hottest O-type stars, the coolest stars in the BAF group, and a number of the OBe stars. For stars with low v sin i, however, these values were supplanted by measurements from the weak metal lines (e.g. N IIλ3995 if present, Si IIIλ4553), and He I (λλ 4168, 4437) as permitted by s/n and spectral type (primarily B-type supergiants and bright giants). Given the small number of measurements per star, formal 68% confidence limits for the FT zeros were estimated using the Student t-distribution. For well-defined FTs, the results for all lines can be identical, and in these cases, formal error estimates were taken to be the resolution of the FT itself. These formal error estimates should be regarded with some caution. Other work suggests that a general uncertainty of about 20% might be appropriate (Simón-Díaz & Herrero 2007). In any case, some indication of problematic measurements can be derived by comparing FT and FWHM results. This is discussed further in Appendix A, where a sample of results are shown (Fig. A.1).
The spectral groups within the BLOeM sample (O, BSG, B-dwarf, OBe, and BAF) required some variation in strategy. For a few of the hottest O-type stars that lacked strong He Iλλ 4143, 4387 lines, we also used the He IIλλ 4026, 4200, and 4542 lines. Since these lines are intrinsically broad, the approach was only used for stars with high v sin i. The cool supergiants (the BAF group) possess numerous sharp lines, and for this group, we used up to ten isolated lines for v sin i measurements, although identification of isolated lines for F-type supergiants is problematic. The OBe group and other emission line stars such as the SgB[e] stars required special attention due to the presence of emission lines that contaminated many of the diagnostic lines. For these stars, we manually identified lines that appeared devoid of emission. These typically were the weak He I lines (noted above) and metal lines, if present. One star, the SgB[e] star BLOeM 2-116, was devoid of absorption lines and is the only source for which we derived a v sin i estimate from its emission lines, as discussed in Appendix B.1.
The FWHM of each line was also derived using a Gaussian fit to the profile and v sin i derived using the conversion factor provided by Collins & Truax (1995), with mean values that we refer to as v sin iFWHM, which is a useful check on v sin iFT concerning the effect of other broadening mechanisms, such as pressure broadening of the He I lines, or the presence of a weak secondary component. We illustrate the latter effect on the B0 III star BLOeM 1-020, discussed by Bestenlehner et al. (2025, their Fig. 14) as having discrepant FT and GOF v sin i estimates, which is attributed to the possible impact of binarity. This is an SB1 system with a measured peak-to-peak (p2p) velocity of ∼100 km s−1 and by merging spectra at each quadrature, we enhanced the presence of the secondary component on opposing wings of each He I line. This is shown in Fig. 2 for the He I 4387 Å line. These wings broaden the merged profile and increase the line width, which leads to an overestimate of the GOF/FWHM results with respect to the FT approach, which is relatively insensitive to their presence provided the profile is dominated by the primary. For example in the case of BLOeM 1-020, the v sin iFT of the He I 4143, 4387, and 4471 Å lines is 81 km s−1, compared with a v sin iFWHM of 127 km s−1. The weaker lines, on the other hand, He I 4168, 4437 Å and Si III 4553 Å, agree better between v sin iFT and v sin iFWHM, with mean values of 88 and 92 km s−1, respectively.
As noted in Shenar et al. (2024), a significant number of double-lined spectroscopic binary (SB2) systems were detected during the spectral classification. While we included these systems in our standard FT approach, we also made a preliminary estimate of v sin i for each individual component. As orbital solutions are not yet available, we defined the stronger component as A and the weaker line system as B. Inspection of the spectra for each epoch of a given source yielded a number of spectra observed with the two components partially separated to at least two-thirds of the line depth, the number of useful spectra depending on s/n, relative strengths of the components, and velocity separation. The FWHM of these components was determined by fitting a double Gaussian and was converted into v sin i as explained above. The lower s/n in single-epoch spectra compared to merged data led to a reliance on the stronger He I and He II lines for these measurements. Furthermore, comparing results for the various lines, it is clear that the lines that are most affected by intrinsic line broadening, such as He I 4471 Å and He II 4542, 4200 Å, tend to give higher v sin i values than He I 4387 Å; for example He I 4387 Å is the least impacted by intrinsic broadening, with He I 4471 Å giving results ∼20% higher. We therefore restricted our results to the means of the estimates from the He I 4387 Å line. The approach outlined here is clearly approximate and should be refined when orbital solutions are available. An important caveat concerns our designation of the A component with stronger lines, typically hydrogen. Without orbital solutions, it is clear that the inferred primary and secondary natures are uncertain, and this should be kept in mind during our discussion of the overall results. Nevertheless, these results provide a first look at the rotation properties of the SB2 systems in BLOeM.
4. Results
We list the v sin iFT and v sin iFWHM results in Table 1. The SB2 procedure outlined in Sect. 3 was applied to 70 of the 91 SB2 systems, the other systems having a too small velocity separation, too little contrast between components, or an insufficient signal-to-noise ratio. This latter group was treated as SB1 systems. Table 2 lists results for the A and B components, but we recall our previously discussed caveat for inferred primary or secondary natures. Figure 3 compares the present results with those by Bestenlehner et al. (2025), analogous to their Fig. 13, reflecting their conclusion that a GOF approach overestimates v sin i. We note that SB2 systems are frequent outliers in this plot because we used the current A component v sin i values in this comparison. This figure also indicates two important features of the different approaches. The FT results converge to a value of ∼30 km s−1, as expected given the spectral resolution of the instrument, while the GOF results converge to zero, although with significant uncertainty. This latter result is a consequence of detecting small perturbations of the instrumental broadening using a GOF approach. Therefore, the comparison of the Bestenlehner et al. (2025) results with our values might provide an indication of which sources in the low v sin i domain have values below our v sin iFT limit, noting also that the former were not corrected for the possible effect of macroturbulence. The low v sin i domain can be explored further using higher resolution (R ∼ 20 000) VLT/Flames data (P.I. L. Mahy).
Mean projected rotational velocities in km s−1 (FT and FWHM values), with their 68% confidence limits, and the number of measured lines.
v sin i values for A and B components of SB2 systems, with 1σ uncertainties, number of used spectra (n), wavelengths of the He I 4387|,Å lines for the A and B components (waveA and waveB), and the epoch number of the spectrum from which they were measured.
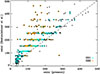 |
Fig. 3. Comparison of pipeline Bestenlehner et al. (2025) results with current measurements (black dots). The banding of the former results is a consequence of their adoption of a discrete grid of v sin i values. SB1 and SB2 systems are flagged as indicated in the legend, and component A v sin i values were adopted for the SB2 sources. The outlier at position (280,81) is the SB2 system BLOeM 5-057, which has very different line widths of 280 and 56 km s−1 for components A and B. Clearly, the pipeline value is appropriate for component B. |
Figure 4 compares v sin i measurements of components A and B, showing a significant correlation, as expected for synchronized systems with similar radii. The periods from the OGLE survey (Pawlak et al. 2016) for 39 of these systems are well determined. The periods for 33 of them are 1–5 d, the periods of 4 are between 5–10 d, and the periods for the last 2 are between 15-20 d. The short periods together with the range and correlation of rotational velocities is most likely a consequence of tidal synchronization (see also Lennon et al. 2024) for most of these systems. There are a number of outliers in the correlation, which might indicate some systems with super-synchronous rotation as a result of recent or ongoing mass transfer. Two examples of such systems with well-defined separated components are BLOeM 1-055 and 5-057, which have v sin iA = 221 ± 55 and v sin iB = 98±13, and v sin iA = 280 ± 24 and v sin iB = 56 ± 2 km s−1, respectively. The former is known to have a period of 3.04 d (Pawlak et al. 2016).
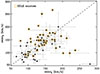 |
Fig. 4. Comparison of v sin i measurements for designated A and B components of SB2 systems. The orange circles denote eclipsing or ellipsoidal binaries with already well-determined periods from the OGLE project (Pawlak et al. 2016). |
In the following discussion of the demographics of the rotation properties of the BLOeM sample, we adopt the v sin iFT results for the bulk of the sources, but we replace the 70 SB2 values with their relevant A v sin i results. Henceforth, we refer to their projected rotational velocities as simply v sin i. We also make use of single SB1 and SB2 designations as assigned in previous BLOeM papers (Shenar et al. 2024; Villaseñor et al. 2025; Britavskiy et al. 2025; Bestenlehner et al. 2025; Sana et al. 2025; Bodensteiner et al. 2025), reproduced in Table C.1 for convenience. Broadly speaking, SB2 systems were identified by visual inspection of the spectra, SB1 systems are those (non-SB2 systems) that passed the two radial velocity (RV) variability criteria1, and the single designation refers to stars that failed both criteria. Some stars (87) were assigned ambiguous binary status flags: SB?, SB1/lpv (lpv = line profile variable), SB2?, etc. These systems are excluded from the single/SB1/SB2 groups in the following discussion, but this exclusion affects the overall statistical picture little. One important exception arises because Villaseñor et al. (2025) subdivided their single cohort (as described above) into two sub-types, RV variable (RVvar) if any pair of RV measurements differed by more than 2σ, otherwise defined as RV constant. However, for consistency with the O and BSG samples, the RVvar sample was absorbed into the single category discussed above. Nevertheless, we recall that many systems with the single label might be long period binaries, the components of which are evolving as single stars, or are (almost) pole-on systems. An important caveat to the above, which should also be kept in mind in the following discussion, is that only a handful of sources have been formally identified as triple systems. Based on previous work (for example Moe & Di Stefano 2017), however, we expect the average OB primary to have between 1.5 and 2.0 companions (for q > 0.1). Therefore, the full effect of triples and higher-order systems on the analysis must await the full analysis of the radial velocity data.
4.1. Demographics of rotation speeds
Figure 5 shows histograms for the full sample, plus the five main BLOeM groups (Shenar et al. 2024); O-stars, the BSG group (luminosity class I and II B-type stars), B-dwarf (luminosity class III-V), OBe (mostly classical Oe and Be stars), and the BAF group (supergiant stars of spectral type B5 and cooler). The strong peak at low v sin i in the full sample is also strongly present in the O and B-dwarf groups, indicating that this feature is not solely due to the supergiants in the full sample. An indication of bi-modality is visible in the O, B-dwarf, and BSG groups, and, as expected, the OBe sample has a moderate to high v sin i.
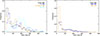 |
Fig. 5. Normalized histograms for the total sample and each of the BLOeM groups, split into two panels for clarity. The groups are identified as indicated by the insets, which also indicate the number of sources in each group. |
It is worth noting that there are significant differences between individual fields. The left panel of Fig. 6 compares the empirical cumulative distribution functions (eCDFs) of v sin i for each field with the full sample. They show varying fractions of low v sin i sources between the fields. A simple K-S test reveals that only fields 2, 4, and 8 have probabilities greater than 0.5 of being drawn from the mean eCDF. The middle and right panels of Fig. 6 show that the stellar luminosities and Gaia (Gaia Collaboration 2016) G-band magnitude distributions are also significantly different. For example, the ratios of massive to intermediate-mass stars and/or stellar age distributions. Only fields 4 and 5 have K-S probabilities greater than 0.1 of being drawn from the mean distributions for these quantities. This field-to-field variation is to be expected, given the patchy location of massive stars in the SMC, for example as indicated by the distribution of its UV sources (Cornett et al. 1997). This is reflected in the differences between the luminosity and G-magnitude eCDFs of each field. For example fields 2 and 3 are incomplete in the G-band magnitude at approximately G = 15 because the bright blue sources in these fields are denser than others, as also indicated by their luminosity functions (central panel). One important bias to be aware of is that the central regions of NGC 346 and NGC 330 were avoided due to crowding issues that affect fields 4 and 7, respectively. In the following discussion, we discuss merged samples across all fields as representing an SMC average picture of the v sin i demographics, but we recall that there are likely local variations compared with other work.
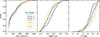 |
Fig. 6. Left: Empirical v sin i cumulative distribution function (eCDF) for the full BLOeM sample (black line) compared with those of each of the eight BLOeM fields (coloured lines). Middle and right: Equivalent eCDFs of luminosity and the GaiaG-band magnitudes. |
4.2. The main sequence
The definition of this region of the HRD that is populated by main-sequence core hydrogen-burning stars, and in particular, the location of the terminal age main sequence (TAMS), is a long-standing problem in stellar evolution. Previous attempts to address this issue used properties such as stellar density, rotational velocity, and binary frequency (Dufton et al. 2006; Hunter et al. 2008a; Vink et al. 2010; Brott et al. 2011; McEvoy et al. 2015; Vink & Oudmaijer 2025; de Burgos et al. 2025). Following Dufton et al. (2006) and Hunter et al. (2008a), we used stellar rotation as an indicator of the main-sequence extent. However, a given v sin i has different implications for stars of differing radii, for example main-sequence versus supergiant stars. Therefore, we used the ratio of v sin i/vcrit as the metric for defining ‘fast’ or ‘slow’ (projected) rotation, where vcrit is the critical velocity. The critical velocities were estimated using the stellar parameters from Bestenlehner et al. (2025) and Patrick et al. (2025) where available, otherwise, we adopted the data from Shenar et al. (2024). To give an example, Fig. 5 indicates that v sin i ∼100 km s−1 is a reasonable estimate for differentiating fast/slow cohorts in the BLOeM sample, which corresponds to v sin i/vcrit > ∼0.15 on the main sequence.
The distribution of BLOeM systems in the Hertzsprung-Russell diagram (HRD) is shown in Fig. 7, colour-coded according to the above ratio. Known OBe stars were removed from this HRD as their parameters are highly uncertain due to disc contamination of their spectra and spectral energy distribution. Their luminosities of most OBe stars were derived by Shenar et al. (2024) using K-band magnitudes, and it is well established that OBe stars have a significant K-band and visible excess due to the presence of their disks (Bonanos et al. 2010; Dunstall et al. 2011).
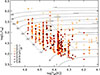 |
Fig. 7. Hertzsprung-Russel diagram of the BLOeM OB sources colour-coded according to the ratio v sin i/vcrit as indicated in the inset. The stellar parameters are taken from Bestenlehner et al. (2025), and the .evolutionary tracks, for illustration, are those of Schootemeijer et al. (2019) assuming αov = 0.33 and αsc = 10. The tracks are labelled with their initial mass in solar units. The large trapezium bounded by diagonal dashed lines between luminosities 4.2 and 5.5 indicates the approximate extent of the fast rotators and main sequence, as discussed in Sect. 4.1. |
Interpreting the over-density of ‘fast’ rotators as indicating the extent of the main sequence, we see a sharp drop in number density towards the cool side of the HRD. This is better visualized in Fig. 8, which plots v sin i as function of distance in Teff from the approximate position of the ZAMS (left dashed diagonal line in Fig. 7). We only counted stars between the horizontal dashed lines indicating the luminosity range log(L/L⊙) = 4.2–5.5 because outside this range, completeness becomes a serious issue. The x-axes of Fig. 8 indicate the Teff a star would have at these luminosity boundaries. This figure shows a significant decrease in the v sin i range at a locus of approximately log(Teff) = 4.26 at log(L/L⊙) = 44.2 to log(Teff) = 44.434 at log(L⊙) = 45.5, as indicated by the vertical dashed line. This locus is also illustrated as the right dashed diagonal line in Fig. 7, which we interpret as indicating the possible position of the TAMS.
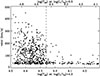 |
Fig. 8. Distribution of v sin i as a function of distance from the ZAMS as indicated by Teff as defined by the lower and upper luminosity boundaries illustrated in Fig. 7. The vertical dashed line indicates the TAMS at these luminosities as defined by the approximate position of the decrease in the v sin i distribution. |
It is worth noting here that an alternative explanation for the decrease in v sin i in Fig. 8 is bi-stability braking during the core hydrogen-burning main sequence (Vink et al. 1999). The appeal of this explanation is that it predicts numerous stars that are cooler than the transition temperature, with the break occurring at approximately the correct location in the stellar HRD. However, a key limitation is that the mass-loss bi-stability jump has so far only been confirmed in luminous blue variables (LBVs), and not more broadly among OB supergiants, in the SMC (Trundle et al. 2004; Trundle & Lennon 2005; Bernini-Peron et al. 2024), LMC (Verhamme et al. 2024), or the Milky Way (Crowther et al. 2006; de Burgos et al. 2024).
Menon et al. (2024) argued that the surface compositions and locations of luminous B-type supergiants in the HRD can be explained as a result of post-main-sequence mergers, as proposed by Podsiadlowski et al. (1990) as the origin of the B-supergiant progenitor of SN1987A. This avoids the need to extend the main sequence to cooler effective temperatures. Clearly, the location of the TAMS is still under debate, and inspection of Fig. 7 indeed shows that the TAMS implied by the stellar evolution tracks used here by way of illustration (Schootemeijer et al. 2019) does not match our notional TAMS location. Further characterization of the BLOeM binaries will shed further light on this subject and will be the subject of future BLOeM papers (in preparation), but in the following, we continue to refer to main-sequence stars as described above.
The v sin i distributions of the main-sequence stars, effectively single stars, SB1, and SB2 systems are shown in Fig. 9. The single systems have a strong peak at low v sin i, with a hint of a secondary peak at intermediate values. This secondary peak is much more pronounced in the SB1 systems, likely indicating differing binary characteristics within these two groups. The SB2 systems lack the low v sin i peak, which is expected given our earlier conclusion that many of these systems are likely synchronized by tides and have short periods (see also Blex et al. 2024). We also show the v sin i distribution of known eclipsing binary systems (from Pawlak et al. 2016), and, assuming common axes of orbital and spin angular momentum, we can infer that this distribution closely reflects that of the equatorial rotation velocities of the A component stars.
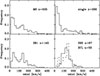 |
Fig. 9. v sin i distributions of non-OBe main-sequence systems together with single SB1 and SB2 systems. The sample sizes are as indicated in the insets. In the SB2 panel (lower right), the v sin i distribution of the eclipsing systems (ECL) in BLOeM is also shown (dashed line). The histogram bin size is 20 km s−1. The total of main-sequence sources is greater than the sum of single SB1 and SB2 as some main-sequence sources have unclear multiplicity designations, as discussed at the beginning of Sect. 4. |
A potential implication of Fig. 9 is that stars with moderate rotation are binaries that have been spun up by tides, while slowly rotating stars are most likely effectively single stars (which may include some fraction of mergers), while stars with the highest v sin i have been spun up by previous mass accretion. Fig. 7 also shows that the low v sin i cohort pervades the main sequence.
4.3. The supergiants
The post-TAMS B-type supergiants, those with luminosity class I, have mainly low v sin i, as expected, although there are some exceptions, as shown in Fig. 8. Those near the TAMS may well just reflect uncertainties in stellar parameters or the TAMS position, or both. A few systems with high v sin i are also found at cooler temperatures, however, for example BLOeM 1-042 (B2 Ib), 4-042 (B2.5 Ib) and 4-105 (B2 Ib:), which are not radial velocity variables. This is consistent with other work, however, because a small number of similar outliers were found in previous v sin i surveys of B-type supergiants in the SMC (Dufton et al. 2006), LMC (Lennon et al. 2010; McEvoy et al. 2015), and Milky Way (Fraser et al. 2010; de Burgos et al. 2025). A notable high v sin i system in this group is BLOeM 3-073 (B3 Ib, v sin i = 103 km s−1), which is a known eclipsing binary (OGLE SMC-ECL-1476; Pawlak et al. 2016), and one of the very few binaries cool-wards of the TAMS. BLOeM 4-096 (B1.5 II:) also has high v sin i, but this system is flagged as an Hα emission line source from Gaia data (Shenar et al. 2024).
The BAF supergiants are even more strongly peaked at lower v sin i. The bulk of these stars have unresolved v sin i estimates at the current resolution (Patrick et al. 2025). Typically, we derive v sin i upper limits for most BAF supergiants of approximately 30 km s−1, which is similar to the results of Verdugo et al. (1999) for 32 A-type supergiants in the Milky Way. The measurements imply a modal value of ∼33 km s−1 as the upper limit in this temperature range, although for F-type supergiants, the values are likely overestimated due to the effect of line crowding and blending on defining a true continuum (see Royer et al. 2002, for discussion of these issues for A and F type stars). For the early B-type supergiants, there is a scattering of objects at higher v sin i that was also noted by Patrick et al. (2025). We illustrate their locations in the HRD in Fig. 10 using parameters from Patrick et al. (2025), and we flag sources whose v sin i values lie significantly above the v sin i limit. Most of these outliers have initial masses lower than ∼10 M⊙, with the higher-mass supergiants being essentially unresolved. The two cool outliers below 8000 K have v sin i values lower that 50 km s−1, and we discounted these for the reasons noted above.
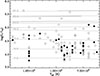 |
Fig. 10. Hertzprung-Russel diagram for the B5 to F-type stars using parameters from Patrick et al. (2025), with stellar evolution tracks from Schootemeijer et al. (2019) labelled according to their initial mass. The filled symbols represent sources whose v sin i measurement is greater than the lower limit of 33 km s−1 by at least 3σ. There is some small overlap with the cool side of Fig. 7. |
4.4. The OBe stars
The v sin i distribution of the BLOeM OBe stars is similar to that in other studies of the SMC and LMC. When the Of?p stars are excluded, the mean and standard deviation of their v sin i measurements are 199 and 77 km s−1, respectively, to be compared with 208 and 88 km s−1 of Dunstall et al. (2011) for a combination of NGC 346 and NGC 330 sources (see Fig. 11). These are only slightly below the values obtained for young OBe populations, NGC 346 alone and the Tarantula Nebular region in the LMC (Dufton et al. 2022). Because the OBe designation is based primarily on the current spectral coverage that excludes Hα, however, we postpone a detailed discussion of their properties to a future paper that will include these data.
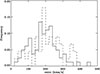 |
Fig. 11. Histograms of v sin i measurements for BLOeM OBe stars (solid line) compared with those of Dunstall et al. (2011), dashed line). The bin size is 20 km s−1. |
5. Comparison with previous work
In the introduction, we noted previous v sin i surveys in the SMC that we briefly summarize below.
-
FSMS (Hunter et al. 2008a) obtained higher-resolution (R∼20 000) VLT/Flames data for two fields in the SMC centred on NGC 346 and NGC 330, which overlap fields 4 and 7 in BLOeM.
-
Martayan (Martayan et al. 2007) obtained VLT/Flames data at similar resolution to BLOeM for two fields in the vicinity of NGC 330.
-
Ramachandran (Ramachandran et al. 2019) obtained similar resolution VLT/Flames data for two fields in the SMC wing.
-
Dufton dufton2019 presented data with a similar resolution for three additional Flames fields centred on NGC 346.
-
RIOTS4 (Dorigo Jones et al. 2020) contains data for a range of resolutions for stars distributed throughout the SMC that were selected as being relatively isolated.
A comparison of v sin i measurements for stars in common with BLOeM in Fig. 12 illustrates the effects of differing resolutions in the low v sin i limit. For example the lower-resolution RIOTS4 data do not resolve values below ∼80 km s−1, while the higher-resolution FSMS results extend below the similar resolution BLOeM/Dufton limit of ∼30–40 km s−1. The BLOeM fields do not overlap the SMC wing fields (Ramachandran et al. 2019). Overall, the agreement across all surveys is reasonable. The small number of outliers above a v sin i of about 60 km s−1 are SB2 systems.
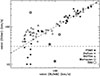 |
Fig. 12. Comparison of this work with v sin i values in the literature, as noted in the inset and described in Sect. 5, where references can also be found. The outliers in this plot are known SB2 systems (circled). The diagonal dashed line indicates the 1:1 correlation, and the horizontal line indicates the approximate lower limit of the BLOeM measurements. |
When the various samples are compared, it is important to consider selection effects and biases. For example Fig. 13 shows the Gaia colour-magnitude diagram (CMD) for the BLOeM targets compared with these other surveys. The various depths and colour cuts are apparent, and we therefore imposed magnitude (G < 16.5 mag) and colour (BP − RP < –0.08; approximately B3) cuts to enable a consistent comparison across all samples for massive main-sequence stars and B-type supergiants. This colour cut excludes the BLOeM BAF, which is unique in this respect, although as discussed above, all but a few BAF stellar spectra are unresolved at our resolution. The comparison of these populations in the HRD in Fig. 14 illustrates the large number of early to mid B-type giants/bright-giants in BLOeM that is unmatched in other surveys. On the other hand, Fig. 14 also illustrates that the young populous region NGC 346 (blue points) populates the region of the HRD closest to the ZAMS, which is only sparsely populated by BLOeM (see Fig. 14).
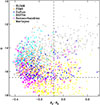 |
Fig. 13. Colour-magnitude diagram for the BLOeM targets (grey squares) compared with those of other major v sin i surveys in the SMC: FSMS (Hunter et al. 2008a), Martayan (Martayan et al. 2007), Ramachandran (Ramachandran et al. 2019), Dufton (Dufton et al. 2019), and RIOTS4 (Dorigo Jones et al. 2020), as indicated in the panel. The dashed lines indicate limits in colour and magnitude assumed for the v sin i comparison. |
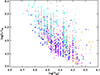 |
Fig. 14. Hertzsprung-Russel diagram of bright blue sources from Fig. 13, colour-coded as in that figure. The Martayan sample is not shown because no stellar luminosities were published. |
The eCDFs of these samples, Fig. 15, for v sin i and luminosity reflect their selection biases, as expected, even with the same colour and magnitude cuts. This is consistent with the significant differences found between the eight BLOeM fields themselves (Fig. 6). The somewhat higher number of stars in the lowest v sin i bins of the FSMS and Dufton samples can be attributed to the higher resolution of the FSMS survey (∼20 000). These stars were also included in the NGC 346 catalogue of Dufton et al. (2019). At ∼50 km s−1, however, the number of slow rotators in BLOeM exceeds those in FSMS and Dufton. By contrast, the RIOTS4 survey observed the bulk of their sample at lower resolution (2600–3700), although some sources were observed at high resolution (28 000). This might explain the lack of stars in the lowest v sin i bins, but at moderate v sin i values, there are still fewer sources than in BLOeM. As RIOTS4 preferentially targeted isolated massive stars, this difference might indicate that these objects are lacking the low v sin i cohort found in BLOeM, although examination of their luminosity eCDFs reveals significant differences.
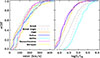 |
Fig. 15. eCDFs for the samples illustrated in Fig. 14. The BLOeM sample (solid grey line) has had a colour cut applied as for the other surveys, as shown in Fig. 13, while a magnitude cut (dashed grey line) was applied at 15.5 for comparison with RIOTS4. The Martayan dataset is missing from the right plot because no luminosity estimates were published for these sources. |
The eCDFs of Martayan and Ramachandran, who used a resolution identical to that of BLOeM, also have a significantly smaller fraction of stars at low v sin i. The HRD/CMD coverages of these two surveys are very different from that of BLOeM, indicating that these surveys are biased towards near main-sequence stars. The lower-mass stars were removed from the eCDFs using the magnitude cut. The Ramachandran and Martayan samples also lack slow rotators, although the former converges to BLOeM at higher v sin i values. The similarity between the Dufton and Ramachandran luminosity functions may seem surprising in view of their differing v sin i eCDFs. The former focused on the NGC 346 region of the SMC, however, which has a significant fraction of stars with ages < 10 Myr (Dufton et al. 2019), while the Ramachandran sample has relatively few stars younger than ∼10 Myr (Ramachandran et al. 2019).
Similar issues of selection biases apply to comparisons with the LMC. For example we can compare with the VFTS survey (Evans et al. 2011) of the 30 Doradus region, which used the same instrument and resolution as BLOeM. Figure 16 shows that while the overall shape of the v sin i distributions are similar, the BLOeM sample is shifted to lower values, while their luminosity distributions indicate that the VFTS sources are intrinsically more luminous. The latter feature is easily understood when we consider that the 30 Doradus field is very young and many of those sources are closer to the ZAMS. We refer again to Fig. 6 and compare the solid and dashed lines. They clearly show that the incompleteness in the BLOeM sample is setting in around G = 15 mag. Evidently, the BLOeM survey is focused more strongly on evolved massive stars.
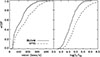 |
Fig. 16. Comparison of v sin i and luminosity eCDFs for BLOeM and VFTS. Both datasets have been restricted to OB stars, but excluding OBe stars. The stellar parameters for the VFTS sources are from McEvoy et al. (2015), Garland et al. (2017), Schneider et al. (2018), Dufton et al. (2018). |
To summarize this section, the metallicity (Z) appears to play a minor role in determining the v sin i distributions, at least compared to other environmental differences. The change in v sin i distributions between regions within the SMC or with regions in other galaxies are strongly affected by the specific characteristics of these massive star populations: mass function, age distribution, etc. To some extent, this is contrary to previous expectations based on the fraction of Be stars in different environments (Maeder et al. 1999; Bonanos et al. 2010; Schootemeijer et al. 2022), which suggests that the initial rotation rate is not an important driver in the production of Be stars.
6. Discussion
Perhaps the most striking result of this survey is the preponderance of stars with low v sin i throughout the main sequence, as discussed in Sect. 4.1 and as illustrated by their distribution in the HRD (Figs. 7 and 9). In typical binary population synthesis paradigms (de Mink et al. 2013; Xu et al. 2025; Schürmann et al. 2025), the slowly rotating cohort is primarily composed of stars that have retained their (modest) initial rotational velocity, unaffected by tides or mass transfer. These are effectively single stars from an evolutionary perspective, even though they may reside in long-period binary systems, as indicated by the low v sin i cohort in the SB1 panel of Fig. 9. A fraction of the low v sin i cohort are also expected to be post-interaction systems, however, such as mergers (Schneider et al. 2019, 2020; Wang et al. 2022; Xu et al. 2025). By contrast, the SB2 systems are consistent with being tidally spun up, are in synchronous rotation, and are a mix of pre- or post-interaction systems. The presence of significant numbers of systems at higher v sin i in the single and SB1 systems would be consistent with a mix of undetected SB2s and post-interaction binaries. Finally, the highest v sin i systems are thought to result from spin-up due to mass accretion in binary systems, perhaps together with the OBe stars, although there are relatively few of the latter in BLOeM compared to VFTS.
In the low v sin i cohort, the N II line at 3995 Å is present in many B-type stars and is suggestive of the N-rich slowly rotating B-type stars discussed by Hunter et al. (2008a, see also Dufton et al. 2018, 2020). As a preliminary test for N-enhancement in the BLOeM slow rotators, we selected a sample of main-sequence B-type stars with v sin i ≤40 km s−1, 43 sources, and compared the N II 3995 Å equivalent widths with theoretical predictions for a range of nitrogen enhancements. The details are summarized in Appendix D. This preliminary analysis implies that ∼30% (17/43) of these slowly rotating stars are enhanced by at least 0.6 dex, while inspection of the radial velocities of the SB1 sources (20% of the sample) suggests that they are long-period systems.
The presence of nitrogen-rich slowly rotating main-sequence B-type stars in the Galaxy, LMC, and SMC is well established (see for example Gies & Lambert 1992; Lennon et al. 2003; Hunter et al. 2008a, 2009; Morel et al. 2008). This is reflected in our data, although we cannot as yet comment on the sources with higher v sin i that would facilitate direct comparison with the Hunter diagram. While a number of potential causes have been put forward to explain the nitrogen enrichment, it is not clear to which extent they might all contribute. As previously noted, stellar mergers might explain some fraction of these systems, which appears to be higher when approaching the TAMS, according to population synthesis predictions (Xu et al. 2025), although others may represent SMC analogues of the magnetic merger candidate τ Scorpii (Schneider et al. 2020), which is closer to the ZAMS. Similarly, Jin et al. (2024) discussed evolutionary scenarios, including mergers, that might explain a large sample of boron-depleted and nitrogen-rich slowly rotating Galactic B-type stars, but they speculated in addition that mixing during the pre-main-sequence might explain some fraction of these nitrogen-enhanced objects. Finally, some fraction of the slowly rotating SB1 sources might be partially stripped post-interaction systems (Shenar et al. 2020; Bodensteiner et al. 2020; Villaseñor et al. 2025; Klencki et al. 2022).
7. Conclusions
We have determined projected rotational velocities (v sin i) for the 929 systems in the BLOeM survey of massive stars in the SMC. We used the Fourier transform method for single stars, and for SB2 systems, a first attempt was made to determine v sin i for both components using a double-Gaussian fitting approach. We summarize the main results below.
-
Using the change in the v sin i distribution with Teff we can define a cool edge of the main sequence of likely core hydrogen-burning stars.
-
The v sin i distributions of main-sequence single and SB1 systems exhibit a strong peak between 30–60 km s−1, close to the resolution limit, indicating the presence of many upper limits. These low v sin i systems pervade the main sequence, and some of them might be long-period systems.
-
Preliminary inspection of the N II 3995 Å line in B-type stars revealed that many of these systems have an enhanced nitrogen abundance, although it is unclear whether this enhancement occurred pre- or post-main sequence.
-
The v sin i distribution of currently designated SB2 systems peaks at ∼140 km s−1, and together with known OGLE periods, this suggests that members of this cohort are mostly high mass-ratio systems in synchronous rotation.
-
Only a very small number, 3%, of the high v sin i stars (> 300 km s−1) are found in the sample. Their potential runaway nature will be considered in a future paper.
-
Internal comparisons between survey fields and with other surveys in the SMC, LMC, and Milky Way suggest that the variations in the derived v sin i distributions are mainly driven by intrinsic stellar population differences and not by metallicity.
Clearly, additional work that is aimed at determining orbital parameters and more precise surface compositions will provide much stronger constraints and further insight into the processes that shape the v sin i distributions presented in this paper.
Data availability
Tables 1, 2, and C.1 are available at the CDS via https://cdsarc.cds.unistra.fr/viz-bin/cat/J/A+A/707/A204.
Acknowledgments
This work has made use of ESASky, TOPCAT, Simbad and Vizier. SRB acknowledges support from the ‘Viera y Clavijo’ postdoctoral program of the Consejerìa de Economía, Conocimiento y Empleo del Gobierno de Canarias through the Agencia Canaria de Investigaciòn, Innovaciòn y Sociedad de la Informaciòn. SRWB, A.H., S.S-D. and G.H. acknowledge support from the State Research Agency (AEI) of the Spanish Ministry of Science and Innovation (MICIN) and the European Regional Development Fund, FEDER under grants PID2021-122397NB-C21 and PID2024-159329NB-C21. G. H. received the support from the “La Caixa” Foundation (ID 100010434) under the fellowship code LCF/BQ/PI23/11970035. DMB gratefully acknowledges UK Research and Innovation (UKRI) in the form of a Frontier Research grant under the UK government’s ERC Horizon Europe funding guarantee (SYMPHONY; grant number: EP/Y031059/1), and a Royal Society University Research Fellowship (grant number: URF\R1\231631). PM acknowledges support from the European Research Council (ERC) under the European Union’s Horizon 2020 research and innovation programme (grant agreement No. 101165213/Star-Grasp), and from the Fonds Wetenschappelijk Onderzoek (FWO) senior postdoctoral fellowship number 12ZY523N T. Shenar, ZK, and TS acknowledge support from the European Research Council (ERC) under the European Union’s Horizon 2020 research and innovation program (grant agreement 101164755/METAL) and the Israel Science Foundation (ISF) under grant number 0603225041. AACS acknowledges support by the Deutsche Forschungsgemeinschaft (DFG, German Research Foundation) in the form of an Emmy Noether Research Group – Project-ID 445674056 (SA4064/1-1, PI Sander). AACS further acknowledges financial support by the Federal Ministry for Economic Affairs and Energy (BMWE) via the Deutsches Zentrum für Luft- und Raumfahrt (DLR) grant 50 OR 2306, co-funded by the European Union (Project 101183150 – OCEANS). A.B. acknowledges support from the Australian Research Council (ARC) Centre of Excellence for Gravitational Wave Discovery (OzGrav), through project number CE230100016. JIV acknowledges support from the European Research Council for the ERC Advanced Grant 101054731. LRP and FN acknowledge support by the Spanish Ministry of Science, Innovation and Universities/State Agency of Research MICIU/AEI/10.13039/501100011033 grants PID2022-137779OB-C41 and PID2022-140483NB-C22, and by “ERDF A way of making Europe”. FN also acknowledges grant MAD4SPACE, TEC-2024/TEC-182 from Comunidad de Madrid (Spain). DP acknowledges financial support from the FWO in the form of a junior postdoctoral fellowship No. 1256225N. his research was supported in part by grant NSF PHY-2309135 to the Kavli Institute for Theoretical Physics (KITP).
References
- Bastian, N., Kamann, S., Amard, L., et al. 2020, MNRAS, 495, 1978 [NASA ADS] [CrossRef] [Google Scholar]
- Berlanas, S. R., Mahy, L., Herrero, A., et al. 2025, A&A, 695, A248 [NASA ADS] [CrossRef] [EDP Sciences] [Google Scholar]
- Bernini-Peron, M., Sander, A. A. C., Ramachandran, V., et al. 2024, A&A, 692, A89 [NASA ADS] [CrossRef] [EDP Sciences] [Google Scholar]
- Bestenlehner, J. M., Crowther, P. A., Bronner, V. A., et al. 2025, MNRAS, 540, 3523 [Google Scholar]
- Blex, S., Haas, M., & Chini, R. 2024, A&A, 692, A192 [NASA ADS] [CrossRef] [EDP Sciences] [Google Scholar]
- Bodensteiner, J., Shenar, T., Mahy, L., et al. 2020, A&A, 641, A43 [NASA ADS] [CrossRef] [EDP Sciences] [Google Scholar]
- Bodensteiner, J., Sana, H., Dufton, P. L., et al. 2023, A&A, 680, A32 [NASA ADS] [CrossRef] [EDP Sciences] [Google Scholar]
- Bodensteiner, J., Shenar, T., Sana, H., et al. 2025, A&A, 698, A38 [NASA ADS] [CrossRef] [EDP Sciences] [Google Scholar]
- Bonanos, A. Z., Lennon, D. J., Köhlinger, F., et al. 2010, AJ, 140, 416 [NASA ADS] [CrossRef] [Google Scholar]
- Bouret, J. C., Lanz, T., Martins, F., et al. 2013, A&A, 555, A1 [NASA ADS] [CrossRef] [EDP Sciences] [Google Scholar]
- Bowman, D. M. 2020, Front. Astron. Space Sci., 7, 70 [Google Scholar]
- Bragança, G. A., Daflon, S., Cunha, K., et al. 2012, AJ, 144, 130 [CrossRef] [Google Scholar]
- Britavskiy, N., Simón-Díaz, S., Holgado, G., et al. 2023, A&A, 672, A22 [NASA ADS] [CrossRef] [EDP Sciences] [Google Scholar]
- Britavskiy, N., Mahy, L., Lennon, D. J., et al. 2025, A&A, 698, A40 [NASA ADS] [CrossRef] [EDP Sciences] [Google Scholar]
- Brott, I., de Mink, S. E., Cantiello, M., et al. 2011, A&A, 530, A115 [NASA ADS] [CrossRef] [EDP Sciences] [Google Scholar]
- Carroll, J. A. 1928, MNRAS, 88, 548 [NASA ADS] [CrossRef] [Google Scholar]
- Carroll, J. A. 1933, MNRAS, 93, 478 [NASA ADS] [CrossRef] [Google Scholar]
- Clark, J. S., Bartlett, E. S., Coe, M. J., et al. 2013, A&A, 560, A10 [NASA ADS] [CrossRef] [EDP Sciences] [Google Scholar]
- Collins, G. W., II, & Truax, R. J. 1995, ApJ, 439, 860 [NASA ADS] [CrossRef] [Google Scholar]
- Cornett, R. H., Greason, M. R., Hill, J. K., et al. 1997, AJ, 113, 1011 [Google Scholar]
- Crowther, P. A., Lennon, D. J., & Walborn, N. R. 2006, A&A, 446, 279 [NASA ADS] [CrossRef] [EDP Sciences] [Google Scholar]
- de Burgos, A., Simón-Díaz, S., Urbaneja, M. A., & Negueruela, I. 2023, A&A, 674, A212 [NASA ADS] [CrossRef] [EDP Sciences] [Google Scholar]
- de Burgos, A., Keszthelyi, Z., Simón-Díaz, S., & Urbaneja, M. A. 2024, A&A, 687, L16 [NASA ADS] [CrossRef] [EDP Sciences] [Google Scholar]
- de Burgos, A., Simón-Díaz, S., Urbaneja, M. A., et al. 2025, A&A, 695, A87 [NASA ADS] [CrossRef] [EDP Sciences] [Google Scholar]
- de Mink, S. E., Langer, N., Izzard, R. G., Sana, H., & de Koter, A. 2013, ApJ, 764, 166 [Google Scholar]
- Dorigo Jones, J., Oey, M. S., Paggeot, K., Castro, N., & Moe, M. 2020, ApJ, 903, 43 [NASA ADS] [CrossRef] [Google Scholar]
- Dufton, P. L., Ryans, R. S. I., Trundle, C., et al. 2005, A&A, 434, 1125 [NASA ADS] [CrossRef] [EDP Sciences] [Google Scholar]
- Dufton, P. L., Ryans, R. S. I., Simón-Díaz, S., Trundle, C., & Lennon, D. J. 2006, A&A, 451, 603 [NASA ADS] [CrossRef] [EDP Sciences] [Google Scholar]
- Dufton, P. L., Langer, N., Dunstall, P. R., et al. 2013, A&A, 550, A109 [NASA ADS] [CrossRef] [EDP Sciences] [Google Scholar]
- Dufton, P. L., Thompson, A., Crowther, P. A., et al. 2018, A&A, 615, A101 [NASA ADS] [CrossRef] [EDP Sciences] [Google Scholar]
- Dufton, P. L., Evans, C. J., Hunter, I., Lennon, D. J., & Schneider, F. R. N. 2019, A&A, 626, A50 [NASA ADS] [CrossRef] [EDP Sciences] [Google Scholar]
- Dufton, P. L., Evans, C. J., Lennon, D. J., & Hunter, I. 2020, A&A, 634, A6 [NASA ADS] [CrossRef] [EDP Sciences] [Google Scholar]
- Dufton, P. L., Lennon, D. J., Villaseñor, J. I., et al. 2022, MNRAS, 512, 3331 [NASA ADS] [CrossRef] [Google Scholar]
- Dunstall, P. R., Brott, I., Dufton, P. L., et al. 2011, A&A, 536, A65 [NASA ADS] [CrossRef] [EDP Sciences] [Google Scholar]
- Evans, C. J., & Howarth, I. D. 2008, MNRAS, 386, 826 [CrossRef] [Google Scholar]
- Evans, C. J., Howarth, I. D., Irwin, M. J., Burnley, A. W., & Harries, T. J. 2004, MNRAS, 353, 601 [NASA ADS] [CrossRef] [Google Scholar]
- Evans, C. J., Taylor, W. D., Hénault-Brunet, V., et al. 2011, A&A, 530, A108 [NASA ADS] [CrossRef] [EDP Sciences] [Google Scholar]
- Fossati, L., Castro, N., Schöller, M., et al. 2015, A&A, 582, A45 [NASA ADS] [CrossRef] [EDP Sciences] [Google Scholar]
- Fraser, M., Dufton, P. L., Hunter, I., & Ryans, R. S. I. 2010, MNRAS, 404, 1306 [NASA ADS] [Google Scholar]
- Frost, A. J., Sana, H., Mahy, L., et al. 2024, Science, 384, 214 [NASA ADS] [CrossRef] [Google Scholar]
- Gaia Collaboration (Prusti, T., et al.) 2016, A&A, 595, A1 [NASA ADS] [CrossRef] [EDP Sciences] [Google Scholar]
- Garland, R., Dufton, P. L., Evans, C. J., et al. 2017, A&A, 603, A91 [NASA ADS] [CrossRef] [EDP Sciences] [Google Scholar]
- Gies, D. R., & Lambert, D. L. 1992, ApJ, 387, 673 [Google Scholar]
- Gray, D. F. 1976, The observation and analysis of stellar photospheres (Cambridge University Press) [Google Scholar]
- Groh, J. H., Meynet, G., Georgy, C., & Ekström, S. 2013, A&A, 558, A131 [NASA ADS] [CrossRef] [EDP Sciences] [Google Scholar]
- Hirschi, R., Goodman, K., Meynet, G., et al. 2025, MNRAS, 543, 2796 [Google Scholar]
- Holgado, G., Simón-Díaz, S., Herrero, A., & Barbá, R. H. 2022, A&A, 665, A150 [NASA ADS] [CrossRef] [EDP Sciences] [Google Scholar]
- Howarth, I. D. 2004, IAU Symp., 215, 33 [NASA ADS] [Google Scholar]
- Howarth, I. D. 2011, MNRAS, 413, 1515 [NASA ADS] [CrossRef] [Google Scholar]
- Howarth, I. D., Walborn, N. R., Lennon, D. J., et al. 2007, MNRAS, 381, 433 [NASA ADS] [CrossRef] [Google Scholar]
- Huang, W., & Gies, D. R. 2006, ApJ, 648, 580 [NASA ADS] [CrossRef] [Google Scholar]
- Hubeny, I. 1988, Comput. Phys. Commun., 52, 103 [Google Scholar]
- Hunter, I., Brott, I., Lennon, D. J., et al. 2008a, ApJ, 676, L29 [NASA ADS] [CrossRef] [Google Scholar]
- Hunter, I., Lennon, D. J., Dufton, P. L., et al. 2008b, A&A, 479, 541 [NASA ADS] [CrossRef] [EDP Sciences] [Google Scholar]
- Hunter, I., Brott, I., Langer, N., et al. 2009, A&A, 496, 841 [NASA ADS] [CrossRef] [EDP Sciences] [Google Scholar]
- Jankov, S. 1995, Publications de l’Observatoire Astronomique de Beograd, 50, 75 [Google Scholar]
- Jin, H., Langer, N., Lennon, D. J., & Proffitt, C. R. 2024, A&A, 690, A135 [NASA ADS] [CrossRef] [EDP Sciences] [Google Scholar]
- Klencki, J., Istrate, A., Nelemans, G., & Pols, O. 2022, A&A, 662, A56 [NASA ADS] [CrossRef] [EDP Sciences] [Google Scholar]
- Lamb, J. B., Oey, M. S., Segura-Cox, D. M., et al. 2016, ApJ, 817, 113 [NASA ADS] [CrossRef] [Google Scholar]
- Langer, N., & Heger, A. 1998, Astrophys. Space Sci. Libr., 233, 235 [NASA ADS] [Google Scholar]
- Lanz, T., & Hubeny, I. 2007, ApJS, 169, 83 [CrossRef] [Google Scholar]
- Lennon, D. J., Dufton, P. L., & Crowley, C. 2003, A&A, 398, 455 [NASA ADS] [CrossRef] [EDP Sciences] [Google Scholar]
- Lennon, D. J., Trundle, C., Hunter, I., et al. 2010, ASP Conf. Ser., 425, 23 [Google Scholar]
- Lennon, D. J., Dufton, P. L., Villaseñor, J. I., et al. 2024, A&A, 688, A141 [NASA ADS] [CrossRef] [EDP Sciences] [Google Scholar]
- Maeder, A., & Meynet, G. 2000, ARA&A, 38, 143 [Google Scholar]
- Maeder, A., Grebel, E. K., & Mermilliod, J.-C. 1999, A&A, 346, 459 [NASA ADS] [Google Scholar]
- Mahy, L., Sana, H., Abdul-Masih, M., et al. 2020, A&A, 634, A118 [NASA ADS] [CrossRef] [EDP Sciences] [Google Scholar]
- Martayan, C., Frémat, Y., Hubert, A. M., et al. 2007, A&A, 462, 683 [NASA ADS] [CrossRef] [EDP Sciences] [Google Scholar]
- McEvoy, C. M., Dufton, P. L., Evans, C. J., et al. 2015, A&A, 575, A70 [NASA ADS] [CrossRef] [EDP Sciences] [Google Scholar]
- Menon, A., Ercolino, A., Urbaneja, M. A., et al. 2024, ApJ, 963, L42 [NASA ADS] [CrossRef] [Google Scholar]
- Moe, M., & Di Stefano, R. 2017, ApJS, 230, 15 [Google Scholar]
- Mokiem, M. R., de Koter, A., Evans, C. J., et al. 2006, A&A, 456, 1131 [NASA ADS] [CrossRef] [EDP Sciences] [Google Scholar]
- Morel, T., Hubrig, S., & Briquet, M. 2008, A&A, 481, 453 [NASA ADS] [CrossRef] [EDP Sciences] [Google Scholar]
- Pasquali, A., Nota, A., Langer, N., Schulte-Ladbeck, R. E., & Clampin, M. 2000, AJ, 119, 1352 [NASA ADS] [CrossRef] [Google Scholar]
- Patrick, L. R., Lennon, D. J., Najarro, F., et al. 2025, A&A, 698, A39 [NASA ADS] [CrossRef] [EDP Sciences] [Google Scholar]
- Pawlak, M., Soszyński, I., Udalski, A., et al. 2016, Acta Astron., 66, 421 [Google Scholar]
- Penny, L. R., & Gies, D. R. 2009, ApJ, 700, 844 [Google Scholar]
- Petit, V., Wade, G. A., Schneider, F. R. N., et al. 2019, MNRAS, 489, 5669 [NASA ADS] [CrossRef] [Google Scholar]
- Podsiadlowski, P., Joss, P. C., & Rappaport, S. 1990, A&A, 227, L9 [NASA ADS] [Google Scholar]
- Podsiadlowski, P., Morris, T. S., & Ivanova, N. 2006, ASP Conf. Ser., 355, 259 [NASA ADS] [Google Scholar]
- Ramachandran, V., Hamann, W. R., Oskinova, L. M., et al. 2019, A&A, 625, A104 [NASA ADS] [CrossRef] [EDP Sciences] [Google Scholar]
- Ramírez-Agudelo, O. H., Simón-Díaz, S., Sana, H., et al. 2013, A&A, 560, A29 [NASA ADS] [CrossRef] [EDP Sciences] [Google Scholar]
- Reeve, D. C., & Howarth, I. D. 2016, MNRAS, 456, 1294 [Google Scholar]
- Renzo, M., Zapartas, E., de Mink, S. E., et al. 2019, A&A, 624, A66 [NASA ADS] [CrossRef] [EDP Sciences] [Google Scholar]
- Royer, F., Gerbaldi, M., Faraggiana, R., & Gómez, A. E. 2002, A&A, 381, 105 [NASA ADS] [CrossRef] [EDP Sciences] [Google Scholar]
- Ryans, R. S. I., Dufton, P. L., Rolleston, W. R. J., et al. 2002, MNRAS, 336, 577 [Google Scholar]
- Sana, H., Ramírez-Agudelo, O. H., Hénault-Brunet, V., et al. 2022, A&A, 668, L5 [NASA ADS] [CrossRef] [EDP Sciences] [Google Scholar]
- Sana, H., Tramper, F., Abdul-Masih, M., et al. 2024, A&A, 688, A104 [NASA ADS] [CrossRef] [EDP Sciences] [Google Scholar]
- Sana, H., Shenar, T., Bodensteiner, J., et al. 2025, Nat. Astron., 9, 1337 [Google Scholar]
- Schneider, F. R. N., Sana, H., Evans, C. J., et al. 2018, Science, 359, 69 [NASA ADS] [CrossRef] [Google Scholar]
- Schneider, F. R. N., Ohlmann, S. T., Podsiadlowski, P., et al. 2019, Nature, 574, 211 [Google Scholar]
- Schneider, F. R. N., Ohlmann, S. T., Podsiadlowski, P., et al. 2020, MNRAS, 495, 2796 [NASA ADS] [CrossRef] [Google Scholar]
- Schootemeijer, A., Langer, N., Grin, N. J., & Wang, C. 2019, A&A, 625, A132 [NASA ADS] [CrossRef] [EDP Sciences] [Google Scholar]
- Schootemeijer, A., Lennon, D. J., Garcia, M., et al. 2022, A&A, 667, A100 [NASA ADS] [CrossRef] [EDP Sciences] [Google Scholar]
- Schürmann, C., Xu, X.-T., Langer, N., et al. 2025, A&A, 704, A219 [NASA ADS] [CrossRef] [EDP Sciences] [Google Scholar]
- Shenar, T., Bodensteiner, J., Abdul-Masih, M., et al. 2020, A&A, 639, L6 [EDP Sciences] [Google Scholar]
- Shenar, T., Bodensteiner, J., Sana, H., et al. 2024, A&A, 690, A289 [NASA ADS] [CrossRef] [EDP Sciences] [Google Scholar]
- Simón-Díaz, S., & Herrero, A. 2007, A&A, 468, 1063 [NASA ADS] [CrossRef] [EDP Sciences] [Google Scholar]
- Simón-Díaz, S., & Herrero, A. 2014, A&A, 562, A135 [NASA ADS] [CrossRef] [EDP Sciences] [Google Scholar]
- Simón-Díaz, S., Godart, M., Castro, N., et al. 2017, A&A, 597, A22 [CrossRef] [EDP Sciences] [Google Scholar]
- Trundle, C., & Lennon, D. J. 2005, A&A, 434, 677 [NASA ADS] [CrossRef] [EDP Sciences] [Google Scholar]
- Trundle, C., Lennon, D. J., Puls, J., & Dufton, P. L. 2004, A&A, 417, 217 [NASA ADS] [CrossRef] [EDP Sciences] [Google Scholar]
- Ud-Doula, A., Owocki, S. P., & Townsend, R. H. D. 2009, MNRAS, 392, 1022 [Google Scholar]
- Verdugo, E., Talavera, A., & Gómez de Castro, A. I. 1999, A&A, 346, 819 [NASA ADS] [Google Scholar]
- Verhamme, O., Sundqvist, J., de Koter, A., et al. 2024, A&A, 692, A91 [NASA ADS] [CrossRef] [EDP Sciences] [Google Scholar]
- Villaseñor, J. I., Sana, H., Mahy, L., et al. 2025, A&A, 698, A41 [NASA ADS] [CrossRef] [EDP Sciences] [Google Scholar]
- Vink, J. S., & Oudmaijer, R. D. 2025, Galaxies, 13, 19 [Google Scholar]
- Vink, J. S., de Koter, A., & Lamers, H. J. G. L. M. 1999, A&A, 350, 181 [Google Scholar]
- Vink, J. S., Brott, I., Gräfener, G., et al. 2010, A&A, 512, L7 [NASA ADS] [CrossRef] [EDP Sciences] [Google Scholar]
- Walborn, N. R., Lennon, D. J., Heap, S. R., et al. 2000, PASP, 112, 1243 [Google Scholar]
- Walborn, N. R., Sana, H., Simón-Díaz, S., et al. 2014, A&A, 564, A40 [NASA ADS] [CrossRef] [EDP Sciences] [Google Scholar]
- Wang, C., Langer, N., Schootemeijer, A., et al. 2022, Nat. Astron., 6, 480 [NASA ADS] [CrossRef] [Google Scholar]
- Wolff, S. C., Strom, S. E., Dror, D., Lanz, L., & Venn, K. 2006, AJ, 132, 749 [NASA ADS] [CrossRef] [Google Scholar]
- Xu, X.-T., Schürmann, C., Langer, N., et al. 2025, A&A, 704, A218 [NASA ADS] [CrossRef] [EDP Sciences] [Google Scholar]
- Yoon, S. C., & Langer, N. 2005, A&A, 443, 643 [NASA ADS] [CrossRef] [EDP Sciences] [Google Scholar]
- Zickgraf, F. J. 2006, ASP Conf. Ser., 355, 135 [Google Scholar]
- Zickgraf, F. J., Kovacs, J., Wolf, B., et al. 1996, A&A, 309, 505 [Google Scholar]
Briefly, the criteria for OB stars are that the peak-to-peak RV amplitude must exceed 20 km s−1, and at least one of the RV pairs differ by more than 4σ.
Appendix A: Fourier transform uncertainties
Some typical Fourier transforms are shown in Fig. A.1, illustrating the reasonable agreement between results for different lines. For these sources the FWHM values are within 10% of the FT values. As noted in Sect. 4, the FT and FWHM values of v sin i may be used to gauge reliability. For example, three stars (5-001, 5-051 and 6-113) have FT uncertainties greater than 100 km s−1. These are the result of poorly defined line profiles due to intrinsic emission (6-113 is an extreme Oe star), poor s/n (5-051), and line profile distortion (5-001 is flagged as a possible SB2 by Lamb et al. 2016). An additional ∼20 sources uncertainties above ∼50 kms and inspection of these spectra reveals a number of similar causes: low s/n, nebular emission, OBe emission, a possible triple system, etc. For most of these cases the FWHM value appears to be more robust, however we have retained the FT values in our analysis as the small number of these outliers has little impact on the overall picture. Nevertheless, for a specific source, of sources, we emphasize the need to examine both FT and FWHM values, and their uncertainties.
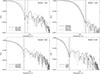 |
Fig. A.1. Example Fourier transforms, with ‘zeros’ (or minima) indicated by vertical lines, the BLOeM identifier and line identifications are inset. Spectral types (and mean v sin i in parenthesis), in clockwise order from top left are B0 III (88 km s−1), B1 Ib (40 km s−1), O9 V:(n) (187 km s−1), and B1.5 II=III (117 km s−1). |
Appendix B: Peculiar/individual objects
B.1. The SgB[e] stars
The SgB[e] stars BLOeM 2-116, 3-012 and 4-055 are more commonly referred to in the literature by their aliases, LHA 115-S 18 (or AzV 154), LHA 115-S 6 (or RMC 4, AzV 16, Sk 11) and LHA 115-S 29 (or RMC 15, Sk 79) respectively. We will therefore refer to these systems as S 18, S 6 and S 29 in this short discussion. Their spectra are dominated by allowed and forbidden emission lines, although S 6 and S 29 also exhibit a B-type absorption line spectrum that contains sharp lines of ions such He I, N II, O II, Mg II, Si II and Si IV. All sources exhibit radial velocity variations for the emission and absorption components, with the absorption lines S 6 and S 29 yielding v sin iFT values of 62 and 50 km s−1 respectively, although these values may be upper limits due to the inability to detect a secondary minimum in the FT. Note that S 6 was also found to be a binary by Zickgraf et al. (1996), who obtained a period of ∼21 yr, and also detected an A-type secondary, although the BLOeM data show no sign of this secondary at any epoch. As noted, S 18 exhibits no reliable absorption lines in our wavelength range, we nevertheless measured v sin i from several weak, isolated, emission lines, obtaining values in the range 30–50 km s−1, though these values may not reflect the rotation rate of the central star.
The low v sin i for S 6 and S 29 are perhaps a little surprising as SgB[e] stars are commonly supposed to be either interacting binaries, or the products of a stellar merger (Langer & Heger 1998; Pasquali et al. 2000; Podsiadlowski et al. 2006) The stellar merger scenario would appear to be inconsistent with the apparent binary nature of of these three systems (S 18 is thought to be a binary due to its X-ray luminosity driven by a colliding wind; Clark et al. 2013). There are only a few published measurements of v sin i for SgB[e] stars, Zickgraf (2006) gives approximate values of 150, 50 and 65 km s−1 for RMC 50, RMC 66 and Hen S93 65 respectively. The present low v sin i results also appear to suggest that on average the primary stars of these systems have rotational velocities well below critical values, perhaps suggesting that these are the donor stars in the systems.
B.2. The O f?p stars
Two BLOeM sources in the OBe group have previously been classified as rare Of?p stars rather than classical Be stars; 2-104 (alias 2dFS 936) and 4-039 (AzV 220) that were both classified as O6.5 f?p by Evans et al. (2004) and Walborn et al. (2000) respectively. Both stars exhibit Balmer emission, being classified as O5.5 f?pe and O6.5 f?pe in Shenar et al. (2024), reflecting the presence of Balmer emission in their spectra (as in previous references quoted above). These stars are known to be magnetic, very slow rotators that exhibit significant variability correlated with their long rotation period (see for example Howarth et al. 2007). Therefore the change in spectral type for 2-104 from O6.5 to O5.5 is not unusual, but reflects the presence of infilling of the He I 4471 Å line by emission in the BLOeM data, which also prohibits the use of this line for v sin i measurement. Its v sin i is 90 km s−1, based on three measurements of 68, 83 and 150 km s−1 for the lines He II 4026 Åand He I 4143, 4387 Å. BLOeM 4-039 on the other hand has a v sin i of 45 km s−1 determined from 7 absorption lines, compared with 62 km s−1 from a GOF determination by Walborn et al. (2000) from high resolution (R = 25 000) data. Both BLOeM measurements, and that of Walborn et al. (2000), should be considered as upper limits and while consistent with these stars’ expected very long rotation periods do not provide meaningful constraints on their values.
B.3. Fast rotators
As Walborn et al. (2014) noted some correlation between high v sin i and potential runaway status we briefly consider a small subset of the highest v sin i systems in BLOeM. Four targets have v sin i measurements in excess of 400 km s−1; BLOeM 3-002 (O6 V:nn), 5-051 (B0.2 III), 7-072 (O8 Vnn) and 8-021 (O7 V-IIInnn pe). BLOeM 3-002 (Simbad name [M2002] SMC 5880) resides in the SMC bar, is not especially isolated, has a rather normal radial velocity (168 km s−1). While formally classed as ‘single’ the star is faint, G = 15.44, and some individual epochs have a s/n as low as 20. A temporal analysis of its line profiles might be informative as some O-type SB2 systems in the past have been classified as On stars (Mahy et al. 2020). BLOeM 5-051 has been flagged as RVvar by Villaseñor et al. (2025), but it is also faint, G = 16.31, and the s/n of each epoch is approximately 20, which may account for the reported variability. BLOeM 7-072 (AzV 251) has an anomalously low radial velocity for the SMC, we derive ∼80 km s−1 (as do Sana et al. 2024, within the X-shooting ULLYSES project), while Dorigo Jones et al. (2020) report this star as a potential runaway with a peculiar transverse velocity of 62 km s−1 from Gaia proper motion data. BLOeM 8-021 (AzV 113) is an Oe star exhibiting typical OBe double peaked emission in its Balmer lines. Its He II 4200,4542 Å lines are in absorption however and yield a mean radial velocity of ∼130 km s−1, not a significant outlier given the SMC’s radial velocity dispersion (Evans & Howarth 2008). A more detailed search for runaway stars will be presented in a forthcoming paper.
Appendix C: Master table
Much of the information used in discussing the various trends revealed here is presented in other papers of the BLOeM series (Shenar et al. 2024; Villaseñor et al. 2025; Britavskiy et al. 2025; Bodensteiner et al. 2025; Patrick et al. 2025; Bestenlehner et al. 2025). Therefore we collect relevant information into a master table, Table C.1, as a convenience for interested readers. This table, available at the CDS contains the following information. Column 1: BLOeM identifier Column 2: Spectral type Column 3: Binary status Column 4: v sin i (km s−1) Column 5: Uncertainty in v sin i (upper) Column 6: Uncertainty in v sin i (lower) Column 7: Teff Column 8: log L/L⊙ Column 9: Evolutionary mass (M⊙) Column 10: Stellar radius (R⊙) Column 11: vcrit (km s−1) Column 12: Field number in which the source lies Column 13: pflag is the parameters flag (see below) Column 14: mflag is the multiplicity flag (see below) Column 15: gflag is the group flag (see below) The pflag denotes the source used for the stellar parameters, in columns 7–11, as follows: -1 – No parameters are available 0 – Shenar et al. (2024) 1 – Bestenlehner et al. (2025) 2 – Patrick et al. (2025) The mflag denotes the multiplicity adopted for sources as described at the beginning of Sect. 4: -1 – not set 0 – single 1 – not used 2 – SB1 3 – SB2 The gflag denotes BLOeM groups as originally defined in Shenar et al. (2024): 0 – O-type stars 1 – B-type dwarfs and giants 2 – B-type supergiants and bright giants 3 – OBe stars 4 – BAF supergiants
Appendix D: Nitrogen in low v sin i systems
To facilitate comparison with previous results we have re-estimated the atmospheric parameters using the same model-atmosphere grid that was calculated with the TLUSTY and SYNSPEC codes (Hubeny 1988; Lanz & Hubeny 2007) as described in Dufton et al. (2005). These models cover an effective temperature range of 10 000 K ≤Teff ≤35 000 K in steps of typically 1 500 K. Logarithmic gravities (in cm s−2) range from 4.5 dex to the Eddington limit in steps of 0.25 dex, and microturbulence velocities are from 0-30 km s−1 in steps of 5 km s−1. In an analogous approach to that adopted by Patrick et al. (2025) for the BAF supergiants, approximate stellar parameters were determined by cross-correlating each spectrum with the SMC metallicity subset of models after convolution with instrumental resolution and appropriate rotational broadening for each star. In addition to enabling a direct comparison with published SMC results, this approach has the additional advantage of closing the ‘gap’ found in Bestenlehner et al. (2025), with few B-type stars having Teff around 25 000 K. As discussed in that paper, the Teff estimates in this region depend on the adopted weighting of different spectral features; for example, effective temperature estimates differing by more than 6 000 K were found for star BLOeM 1-105, depending on the adopted weighting. The present revised effective temperature estimates are now more uniformly spread with seven targets having estimates between 24 000 and 30 000 K. Gravity estimates were normally either 3.5 or 4.0 dex with higher values being found for some of the hotter stars. Microturbulence values of 0 (30 targets), 5 (4 targets) and 10 km s−1 (9 targets) were deduced.
Of the 43 stars in this sample, reliable equivalent width measurements of the N II 3995Å line are possible in 34 cases; we used the same techniques as in Dufton et al. (2018, 2020) where further details can be found. These equivalent widths are plotted in Fig. D.1 as a function of our Teff estimates. Dufton et al. (2020) has reviewed nitrogen abundances found in stars and H II regions in the SMC and adopted a baseline abundance of 6.5 dex. We have used this baseline in Fig. D.1 and show the loci of theoretical equivalent widths deduced from our grid of models for a microturbulence of 5km s−1 and for log g of 3.5 and 4.0 dex. Also plotted are loci for nitrogen enhancements of up to 0.9 dex.
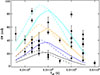 |
Fig. D.1. Estimates of the equivalent widths for the N II line at 3995Å for sources with v sin i ≤40 km s−1 plotted against effective temperature. Formal uncertainties in Teff are half the grid separation, which can be inferred from inspection of the figure. Also shown are theoretical predictions for two gravities; log g = 4.0 dex (solid lines) and 3.5 dex (dotted lines). Black curves are for the SMC baseline nitrogen abundance of 6.5 dex, with other curves showing enhancements of 0.3 dex (blue), 0.6 dex (orange) and 0.9 dex (cyan). SB1 systems are circled. |
Inspection of Fig. D.1 implies that most targets have significant nitrogen enhancements. In Table D.1, we summarize the number of stars with different levels of enhancement. Also listed are results for the SMC region of NGC346 (Dufton et al. 2020) and for 30 Doradus in the LMC (Dufton et al. 2018). The percentages of nitrogen enhanced stars are very similar for the two SMC studies but are larger than those for the LMC survey; this is not surprising given the different baseline nitrogen abundances. Also noteworthy is that roughly one fifth of this subsample are SB1 systems, and a preliminary check of their radial velocities implies that their periods are long, and of order tens of days. While a full orbital and atmospheric analysis of the sample is beyond the scope of present paper, inspection of Fig. D.1 implies that ∼30% (17/43) of the slowly rotating single and binary B-type stars are enhanced by at least 0.6 dex.
Number and percentages of nitrogen enriched stars with v sin i ≤ 40 km s−1, where N is the number of B-type stars with luminosity classes III-V in each survey.
All Tables
Mean projected rotational velocities in km s−1 (FT and FWHM values), with their 68% confidence limits, and the number of measured lines.
v sin i values for A and B components of SB2 systems, with 1σ uncertainties, number of used spectra (n), wavelengths of the He I 4387|,Å lines for the A and B components (waveA and waveB), and the epoch number of the spectrum from which they were measured.
Number and percentages of nitrogen enriched stars with v sin i ≤ 40 km s−1, where N is the number of B-type stars with luminosity classes III-V in each survey.
All Figures
|
Fig. 1. Distribution of BLOeM targets (white circles) compared with those of some other major v sin i surveys: FSMS (Hunter et al. 2008b, orange), Martayan (Martayan et al. 2007, yellow), Ramachandran (Ramachandran et al. 2019, magenta), Dufton (Dufton et al. 2019, blue), and RIOTS4 (Dorigo Jones et al. 2020, cyan). |
| In the text | |
|
Fig. 2. Two He I 4387 Å line profiles for the source BLOeM 1-020, which is classified as an SB1 system and has a peak-to-peak velocity of ∼100 km s−1. The full and dashed lines show the profiles obtained at each quadrature. A faint secondary is visible on opposing sides of each profile. |
| In the text | |
|
Fig. 3. Comparison of pipeline Bestenlehner et al. (2025) results with current measurements (black dots). The banding of the former results is a consequence of their adoption of a discrete grid of v sin i values. SB1 and SB2 systems are flagged as indicated in the legend, and component A v sin i values were adopted for the SB2 sources. The outlier at position (280,81) is the SB2 system BLOeM 5-057, which has very different line widths of 280 and 56 km s−1 for components A and B. Clearly, the pipeline value is appropriate for component B. |
| In the text | |
|
Fig. 4. Comparison of v sin i measurements for designated A and B components of SB2 systems. The orange circles denote eclipsing or ellipsoidal binaries with already well-determined periods from the OGLE project (Pawlak et al. 2016). |
| In the text | |
|
Fig. 5. Normalized histograms for the total sample and each of the BLOeM groups, split into two panels for clarity. The groups are identified as indicated by the insets, which also indicate the number of sources in each group. |
| In the text | |
|
Fig. 6. Left: Empirical v sin i cumulative distribution function (eCDF) for the full BLOeM sample (black line) compared with those of each of the eight BLOeM fields (coloured lines). Middle and right: Equivalent eCDFs of luminosity and the GaiaG-band magnitudes. |
| In the text | |
|
Fig. 7. Hertzsprung-Russel diagram of the BLOeM OB sources colour-coded according to the ratio v sin i/vcrit as indicated in the inset. The stellar parameters are taken from Bestenlehner et al. (2025), and the .evolutionary tracks, for illustration, are those of Schootemeijer et al. (2019) assuming αov = 0.33 and αsc = 10. The tracks are labelled with their initial mass in solar units. The large trapezium bounded by diagonal dashed lines between luminosities 4.2 and 5.5 indicates the approximate extent of the fast rotators and main sequence, as discussed in Sect. 4.1. |
| In the text | |
|
Fig. 8. Distribution of v sin i as a function of distance from the ZAMS as indicated by Teff as defined by the lower and upper luminosity boundaries illustrated in Fig. 7. The vertical dashed line indicates the TAMS at these luminosities as defined by the approximate position of the decrease in the v sin i distribution. |
| In the text | |
|
Fig. 9. v sin i distributions of non-OBe main-sequence systems together with single SB1 and SB2 systems. The sample sizes are as indicated in the insets. In the SB2 panel (lower right), the v sin i distribution of the eclipsing systems (ECL) in BLOeM is also shown (dashed line). The histogram bin size is 20 km s−1. The total of main-sequence sources is greater than the sum of single SB1 and SB2 as some main-sequence sources have unclear multiplicity designations, as discussed at the beginning of Sect. 4. |
| In the text | |
|
Fig. 10. Hertzprung-Russel diagram for the B5 to F-type stars using parameters from Patrick et al. (2025), with stellar evolution tracks from Schootemeijer et al. (2019) labelled according to their initial mass. The filled symbols represent sources whose v sin i measurement is greater than the lower limit of 33 km s−1 by at least 3σ. There is some small overlap with the cool side of Fig. 7. |
| In the text | |
|
Fig. 11. Histograms of v sin i measurements for BLOeM OBe stars (solid line) compared with those of Dunstall et al. (2011), dashed line). The bin size is 20 km s−1. |
| In the text | |
|
Fig. 12. Comparison of this work with v sin i values in the literature, as noted in the inset and described in Sect. 5, where references can also be found. The outliers in this plot are known SB2 systems (circled). The diagonal dashed line indicates the 1:1 correlation, and the horizontal line indicates the approximate lower limit of the BLOeM measurements. |
| In the text | |
|
Fig. 13. Colour-magnitude diagram for the BLOeM targets (grey squares) compared with those of other major v sin i surveys in the SMC: FSMS (Hunter et al. 2008a), Martayan (Martayan et al. 2007), Ramachandran (Ramachandran et al. 2019), Dufton (Dufton et al. 2019), and RIOTS4 (Dorigo Jones et al. 2020), as indicated in the panel. The dashed lines indicate limits in colour and magnitude assumed for the v sin i comparison. |
| In the text | |
|
Fig. 14. Hertzsprung-Russel diagram of bright blue sources from Fig. 13, colour-coded as in that figure. The Martayan sample is not shown because no stellar luminosities were published. |
| In the text | |
|
Fig. 15. eCDFs for the samples illustrated in Fig. 14. The BLOeM sample (solid grey line) has had a colour cut applied as for the other surveys, as shown in Fig. 13, while a magnitude cut (dashed grey line) was applied at 15.5 for comparison with RIOTS4. The Martayan dataset is missing from the right plot because no luminosity estimates were published for these sources. |
| In the text | |
|
Fig. 16. Comparison of v sin i and luminosity eCDFs for BLOeM and VFTS. Both datasets have been restricted to OB stars, but excluding OBe stars. The stellar parameters for the VFTS sources are from McEvoy et al. (2015), Garland et al. (2017), Schneider et al. (2018), Dufton et al. (2018). |
| In the text | |
|
Fig. A.1. Example Fourier transforms, with ‘zeros’ (or minima) indicated by vertical lines, the BLOeM identifier and line identifications are inset. Spectral types (and mean v sin i in parenthesis), in clockwise order from top left are B0 III (88 km s−1), B1 Ib (40 km s−1), O9 V:(n) (187 km s−1), and B1.5 II=III (117 km s−1). |
| In the text | |
|
Fig. D.1. Estimates of the equivalent widths for the N II line at 3995Å for sources with v sin i ≤40 km s−1 plotted against effective temperature. Formal uncertainties in Teff are half the grid separation, which can be inferred from inspection of the figure. Also shown are theoretical predictions for two gravities; log g = 4.0 dex (solid lines) and 3.5 dex (dotted lines). Black curves are for the SMC baseline nitrogen abundance of 6.5 dex, with other curves showing enhancements of 0.3 dex (blue), 0.6 dex (orange) and 0.9 dex (cyan). SB1 systems are circled. |
| In the text | |
Current usage metrics show cumulative count of Article Views (full-text article views including HTML views, PDF and ePub downloads, according to the available data) and Abstracts Views on Vision4Press platform.
Data correspond to usage on the plateform after 2015. The current usage metrics is available 48-96 hours after online publication and is updated daily on week days.
Initial download of the metrics may take a while.