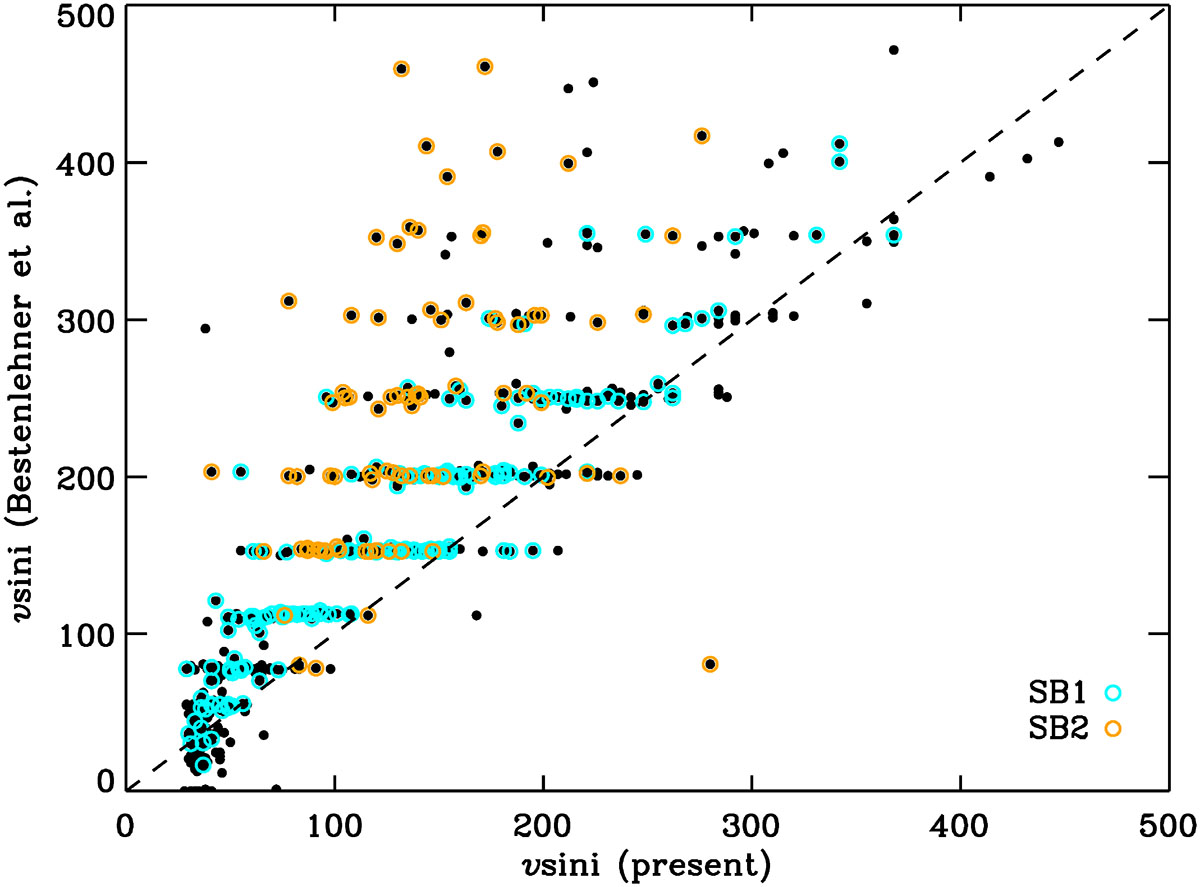
Fig. 3.
Download original image
Comparison of pipeline Bestenlehner et al. (2025) results with current measurements (black dots). The banding of the former results is a consequence of their adoption of a discrete grid of v sin i values. SB1 and SB2 systems are flagged as indicated in the legend, and component A v sin i values were adopted for the SB2 sources. The outlier at position (280,81) is the SB2 system BLOeM 5-057, which has very different line widths of 280 and 56 km s−1 for components A and B. Clearly, the pipeline value is appropriate for component B.
Current usage metrics show cumulative count of Article Views (full-text article views including HTML views, PDF and ePub downloads, according to the available data) and Abstracts Views on Vision4Press platform.
Data correspond to usage on the plateform after 2015. The current usage metrics is available 48-96 hours after online publication and is updated daily on week days.
Initial download of the metrics may take a while.