Fig. 5.
Download original image
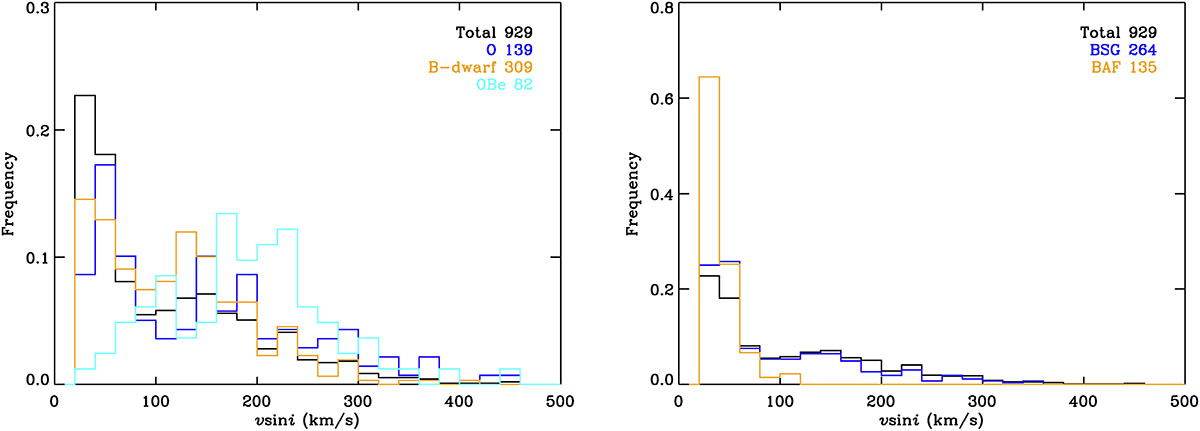
Normalized histograms for the total sample and each of the BLOeM groups, split into two panels for clarity. The groups are identified as indicated by the insets, which also indicate the number of sources in each group.
Current usage metrics show cumulative count of Article Views (full-text article views including HTML views, PDF and ePub downloads, according to the available data) and Abstracts Views on Vision4Press platform.
Data correspond to usage on the plateform after 2015. The current usage metrics is available 48-96 hours after online publication and is updated daily on week days.
Initial download of the metrics may take a while.