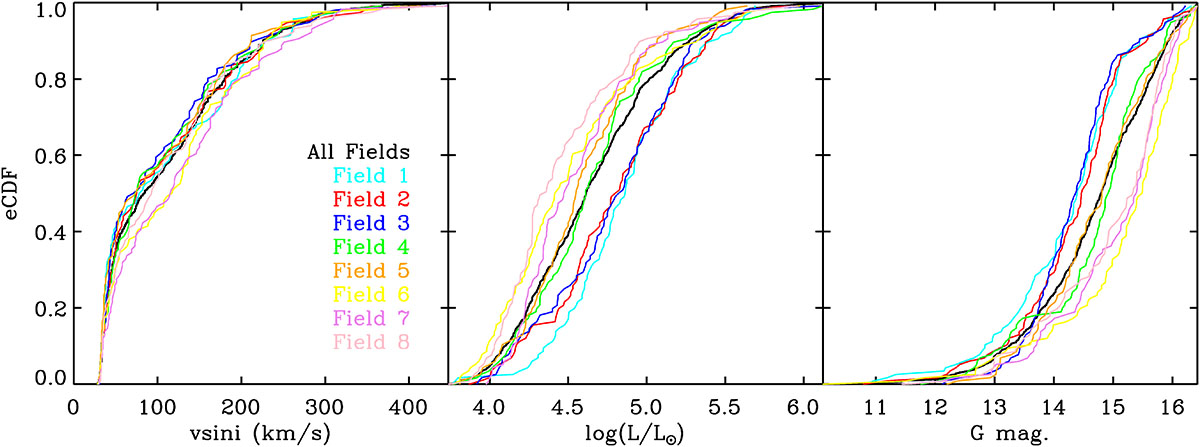
Fig. 6.
Download original image
Left: Empirical v sin i cumulative distribution function (eCDF) for the full BLOeM sample (black line) compared with those of each of the eight BLOeM fields (coloured lines). Middle and right: Equivalent eCDFs of luminosity and the GaiaG-band magnitudes.
Current usage metrics show cumulative count of Article Views (full-text article views including HTML views, PDF and ePub downloads, according to the available data) and Abstracts Views on Vision4Press platform.
Data correspond to usage on the plateform after 2015. The current usage metrics is available 48-96 hours after online publication and is updated daily on week days.
Initial download of the metrics may take a while.