Open Access
Fig. 4
Download original image
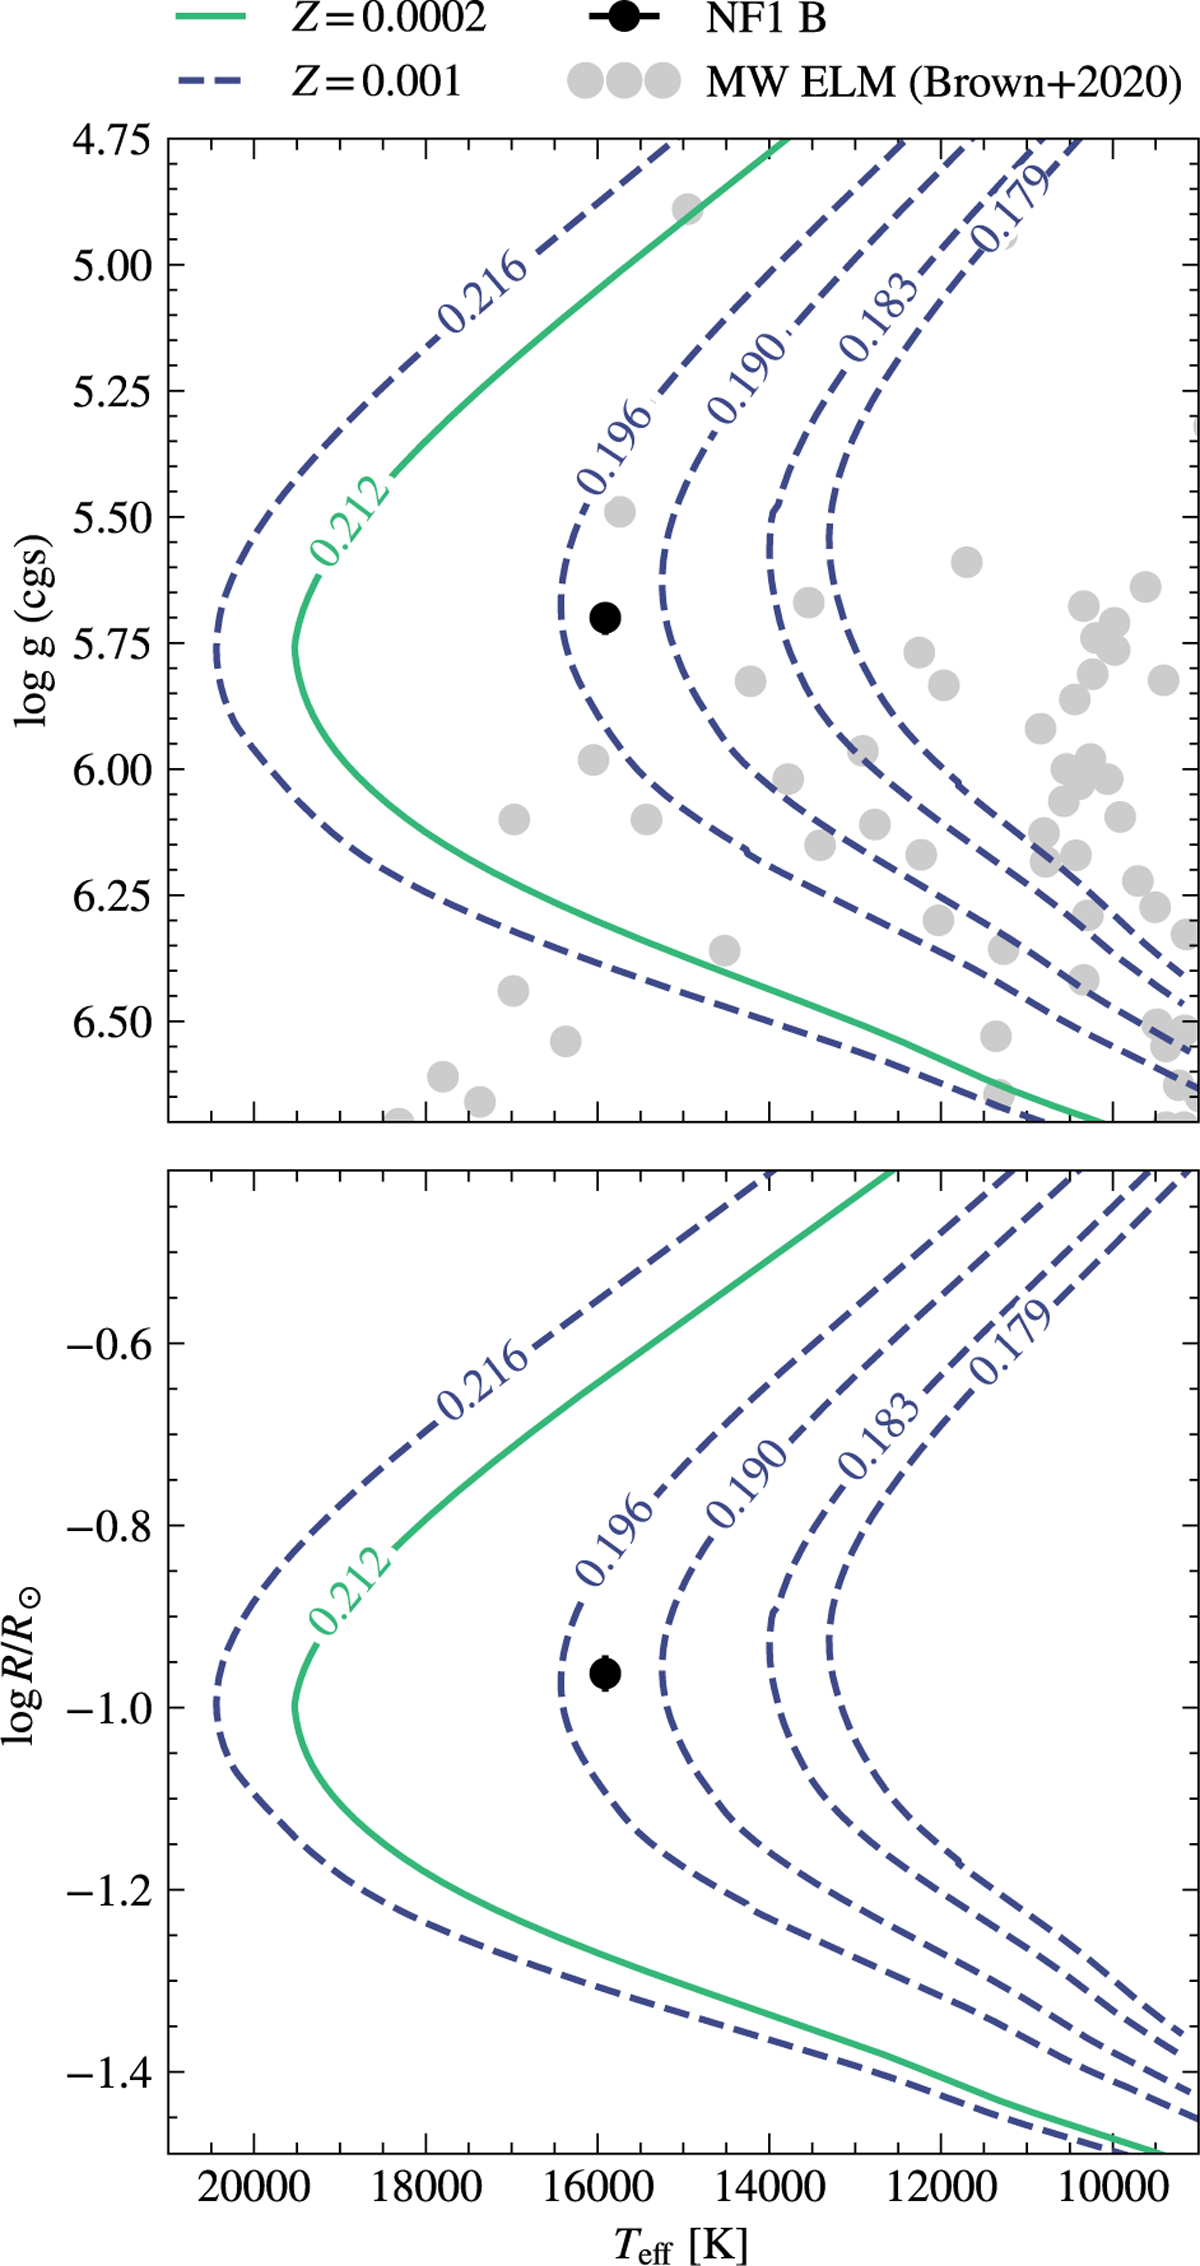
Position of NF1 B in the log g-Teff diagram (top) and log R-Teff diagram (bottom) compared to selected model tracks including rotation and diffusion from Istrate et al. (2016). The labels along the tracks give the stellar mass in solar masses. The grey points represent the Milky Way ELMs from the Brown et al. (2020) survey.
Current usage metrics show cumulative count of Article Views (full-text article views including HTML views, PDF and ePub downloads, according to the available data) and Abstracts Views on Vision4Press platform.
Data correspond to usage on the plateform after 2015. The current usage metrics is available 48-96 hours after online publication and is updated daily on week days.
Initial download of the metrics may take a while.