| Issue |
A&A
Volume 707, March 2026
|
|
|---|---|---|
| Article Number | A261 | |
| Number of page(s) | 10 | |
| Section | Galactic structure, stellar clusters and populations | |
| DOI | https://doi.org/10.1051/0004-6361/202558594 | |
| Published online | 17 March 2026 | |
Discovery of a double white dwarf in the Galactic globular cluster NGC 6397
1
Institut für Astrophysik und Geophysik, Georg-August-Universität Göttingen,
Friedrich-Hund-Platz 1,
37077
Göttingen,
Germany
2
Dr. Karl Remeis-Observatory & ECAP, Astronomical Institute, Friedrich-Alexander University Erlangen-Nuremberg,
Sternwartstr. 7,
96049
Bamberg,
Germany
3
Astrophysics Research Institute, Liverpool John Moores University,
IC2 Liverpool Science Park, 146 Brownlow Hill,
Liverpool
L3 5RF,
UK
4
Department of Astronomy & Astrophysics, University of California,
San Diego,
La Jolla,
CA 92093,
USA
★ Corresponding author: This email address is being protected from spambots. You need JavaScript enabled to view it.
Received:
16
December
2025
Accepted:
5
February
2026
Abstract
Binaries in the cores of globular clusters are known to prevent the gravitational collapse of the cluster, and simulations predict that the core of NGC 6397 contains a high number of white dwarfs (WDs), of which many are expected to be part of a binary system. In this work, we report the discovery of a compact binary system consisting of two WDs in the centre of the Galactic globular cluster NGC 6397. The system, known in the literature as NF1, was observed as part of a MUSE radial-velocity survey aiming at characterizing the binary population in the centre of NGC 6397. The spectral analysis of NF1 provides an effective temperature of 16 000 K and a surface gravity (log g) of 5.72 (cgs), which is consistent with the characteristics of an extremely low-mass He-core WD. This is further supported by the mass of 0.23 ± 0.03 M⊙ obtained from fitting the star’s spectral energy distribution using its HST magnitude in various filters. The system has a circular orbit with a period of 0.54 days. The radial velocities show a large semi-amplitude of 200 km/s, implying a minimum mass of 0.78 M⊙ for the invisible companion, which is likely another WD, or a neutron star if the inclination of the system is smaller than about 50°. Some significant residuals in radial velocity remain with our best orbital solution, and we tested whether a model with a third body can explain these deviations. While this possibility seems promising, additional measurements are needed to confirm whether the star is actually part of a triple system.
Key words: techniques: imaging spectroscopy / binaries: close / binaries: spectroscopic / white dwarfs / globular clusters: individual: NGC 6397
© The Authors 2026
 Open Access article, published by EDP Sciences, under the terms of the Creative Commons Attribution License (https://creativecommons.org/licenses/by/4.0), which permits unrestricted use, distribution, and reproduction in any medium, provided the original work is properly cited.
This article is published in open access under the Subscribe to Open model. This email address is being protected from spambots. You need JavaScript enabled to view it. to support open access publication.
1 Introduction
The dense cores of globular clusters (GCs) contain an abundance of stellar exotica, including the massive remnants of stars, such as white dwarfs (WDs), neutron stars, and black holes. Binaries influence the dynamical state of their host GC. As the GC evolves, the more massive objects, including binaries, black holes, and massive white WDs (>0.8 M⊙), accumulate in the GC centre due to mass segregation. In the GC core, the binaries support the GC against core collapse. With time, they are either destroyed or ejected from the GC after interactions with other stars (Kremer et al. 2019). In particular, very compact binaries consisting of heavy objects emit potentially detectable amounts of gravitational waves (Kremer et al. 2021).
Extremely low mass (ELMs) WDs are He-core WDs with a mass below 0.3 M⊙. Because of their low mass and their degenerate interior, ELMs are the largest and brightest WDs. They are known to exist in the Milky Way, typically as part of a compact binary system (see e.g. Webbink 1975; Marsh et al. 1995; Brown et al. 2020). This is intrinsically linked to their formation, which can only be explained as a result of binary interaction since the universe is too young to form low-mass WDs from single star evolution. In GCs, ELMs were so far observed as companions of millisecond pulsars (e.g. Mata Sánchez et al. 2020; Cadelano et al. 2020) and recently discovered as companions of blue straggler stars in NGC 362 (Dattatrey et al. 2023). Previous photometric observations of bright WDs and their central concentration in NGC 6397 (Cool et al. 1998) suggest that they could be part of binary systems with a more massive but invisible companion, most likely a carbon-oxygen WD (Hansen et al. 2003; Strickler et al. 2009). Their position in the colour-magnitude diagram (CMD, Strickler et al. 2009) and the spectroscopic analysis of one of these bright WDs (Edmonds et al. 1999) are consistent with He-core WDs.
NGC 6397 is a core-collapsed GC situated at a distance of 2.4 kpc, making it the second-closest GC to Earth. Kinematical analyses of NGC 6397 suggest that its core contains either a dark component, such as an intermediate-mass black hole, or many stellar remnants (Kamann et al. 2016), such as WDs (Arnold & Baumgardt 2025). Monte Carlo simulations of the cluster also suggest that it contains a central, diffuse cluster of WDs in its core (Kremer et al. 2021; Vitral et al. 2022). This subsystem has a mass of about 103 M⊙ and consists mostly of carbonoxygen and oxygen-neon WDs. The simulations also contain a low number of He-core WDs, which scales with the primordial binary fraction because He-core WDs only form in binary systems. In this central cluster of WDs, binaries consisting of two WDs also form due to high stellar density. These binaries are hardened and are either ultimately destroyed when the WDs merge after a gravitational-wave inspiral, or ejected from the GC after interaction with single stars or binaries (Kremer et al. 2021; Weatherford et al. 2023). These processes are hard to observe since most WDs are intrinsically faint, unless they are part of a cataclysmic variable where the WD accretes from a nondegenerate companion, i.e. a main-sequence star. White dwarf binaries consisting of at least one He-core WD are much easier to detect from radial velocity measurements than those without a He-core WD because these are brighter than the other types. Moreover, since they are also less massive, their radial velocity (RV) amplitude is larger.
NF1 in NGC 6397 is part of a group of UV-bright stars located close to the centre of the cluster (Cool et al. 1998, see Fig. A.1 for a finding chart). These stars are located bluewards of the main sequence and below the main-sequence turn-off in colour-magnitude diagrams. UV light curves show that some of these stars are photometrically variable on timescales of hours and ‘flicker’ on even shorter timescales, while others show no photometric variability (‘nonflickerers’, NF). While the flicker-ers are known or suspected cataclysmic variables, Cool et al. (1998) propose that the NFs are low-mass He-core WDs in a binary, either with a faint and low-mass main-sequence star (m < 0.15 M⊙), a cool WD, or a neutron star. Hansen et al. (2003) used theoretical cooling models and relations between orbital parameters and exchange times in star clusters to infer that the binary companions of the NFs are more likely to be CO-WDs than neutron stars, and that they were likely formed in the last 108 years. Recently, Pichardo Marcano et al. (2025) found that the UV light curve of NF1 varies with low amplitude, which they attribute to spots caused by magnetic fields. However, they did not detect clear periodicity in their signal.
In this paper, we use NF1 AB to designate the binary system with its more massive, invisible, primary component NF1 A and its visible secondary NF1 B. The paper is structured as follows: Section 2 lists the MUSE and Hubble Space Telescope (HST) data used in this work. Section 3 presents the methods used for the spectroscopic and spectral energy distribution (SED) fits and for the radial velocity analysis. Section 4 presents the stellar and orbital parameters, and we discuss our results in Section 5. Finally, we conclude in Section 6.
2 Data
We used spectra obtained with MUSE, an optical integral-field spectrograph at the VLT (Bacon et al. 2010). MUSE has a large field of view of 1′ × 1′ with spatial sampling of 0.2" and is equipped with adaptive optics (AO). It covers the spectral range from 4750 to 9350 Å at a constant sampling of 1.25 Å with a spectral resolution of 1800 in the blue and 3500 in the red. The data were obtained as part of an observation programme to detect binary systems in the centre of NGC 6397 (Programme ID 0111.D-2117(A), PI: S. Dreizler). A total exposure time of 4.4 h was split into 20 epochs, which were observed from May 2023 to August 2023 using AO (see Table A.1). Each MUSE data cube consists of four exposures with different de-rotator positions, each with an exposure time of 200 s. We reduced the data with the MUSE pipeline (Weilbacher et al. 2020, version 2.8.9). The data cubes produced by the pipeline were then analysed with PampelMuse (Kamann et al. 2013), which extracts spectra of individual stars using point spread function fitting. The individual spectra of NF1 AB have a signal-to-noise (S/N) ranging from 7 to 18, depending on the observing conditions. We did not include archival MUSE data from 2014 (Kamann et al. 2016; Husser et al. 2016) and 2017 because they were taken without AO and have a lower S/N.
We used the HST Legacy Survey of Galactic Globular Clusters (HUGS, Piotto et al. 2015; Nardiello et al. 2018) and the Hubble Space Telescope Atlases of Cluster Kinematics (HACKS, Libralato et al. 2022) photometric catalogues of NGC 6397 to collect the photometric measurements of NF1 AB from the UV to the red visual band (see Table A.2). In addition, the HACKS catalogue also contains relative proper motions, which we used to verify the cluster membership of NF1 AB.
3 Analysis methods
3.1 Spectral fit and spectral energy distribution
The MUSE spectra of NF1 AB were first fitted using spexxy and the Göttingen Spectral Library (Husser et al. 2013, 2016) to estimate their radial velocities and reproduce the telluric lines. Telluric contamination was then removed from the individual spectra, which were shifted to rest-frame velocity and finally co-added to obtain a higher S/N spectrum (see Fig. 1).
The Göttingen Spectral Library does not cover the parameter range of NF1 AB, so we used a different model grid to fit its spectrum. We used models computed with the ADS approach (Przybilla et al. 2011; Irrgang et al. 2021), which uses the ATLAS12, DETAIL, and SURFACE codes to produce hybrid LTE and NLTE model atmospheres suitable for compact hot stars such as those on the blue horizontal branch and the hottest blue stragglers. These models have been used by Latour et al. (2023, see their Sect. 3 for a detailed summary of the models and the parameter coverage of the grids) to analyse horizontal branch stars and some hot blue stragglers in NGC 6752 and ω Centauri. The model grids cover four dimensions: Teff, log g, helium abundance, and metallicity. Most importantly, they cover the appropriate atmospheric parameter range of NF1 AB1 (see Sect. 4.2). He-core WDs are less compact than typical CO-core WDs, but gravitational settling is nevertheless effective at removing metals from their photosphere, and they are expected to have low metallicity (see e.g. Gianninas et al. 2014). Therefore, because the stars in NGC 6397 have a metallicity of [Fe/H] = −2.0 (Harris 1996, 2010 edition), we used our lowest solar-scaled metallicity ([M/H] = −2.0) grid to fit the spectrum of NF1 AB. The spectrum was fitted using the Interactive Spectral Interpretation System (ISIS) with an updated version of the χ2-minimization method presented in Irrgang et al. (2014). In the case of NF1 AB, the only visible spectral lines are the hydrogen Balmer lines, Hα and Hβ, as well as a few Paschen lines. The fit to the MUSE spectrum allowed us to constrain Teff and log g, and estimate an upper limit to the He abundance.
In addition to fitting the MUSE spectrum to derive the atmospheric parameters, the SED of NF1 AB was fitted to derive additional stellar parameters, namely the radius, luminosity, and mass of the star. The synthetic fluxes in the various HST filters were constructed from the grid of ATLAS12 model atmospheres. The observed SED of NF1 AB comprises the magnitude measurements listed in Table A.2. A general description of the SED fitting method is presented in Heber et al. (2018) and Irrgang et al. (2018). For NF1 AB, we used the known distance and reddening of NGC 6397 and fixed these values to D = 2.4 ± 0.1 kpc and E(B - V) = 0.18 mag (Brown et al. 2018; Maíz Apellániz et al. 2021; Harris 1996, 2010 edition). Since surface gravity cannot be well constrained by photometry, it was also kept fixed to the value obtained from the MUSE spectrum. The two parameters left free to vary during the SED fit were thus Teff and the angular diameter (Θ = R/D). From Θ, we directly obtained the radius R since the distance is known. From the radius, the luminosity and mass were obtained via the formulae L = 4πR2σT4eff and M = gR2/G.
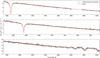 |
Fig. 1 Best fit to the combined MUSE spectrum of NF1 AB. The observed spectrum combines 19 individual spectra with a total exposure time of 4.2 hours. |
3.2 Radial velocities and orbital modelling
The initial radial velocities derived from the MUSE observations and the Göttingen Spectral Library show clear amplitude variation, indicating that the star is part of a binary system. Because the spectral library does not contain WD models, we re-computed the radial velocities of the individual spectra using the best-fitting synthetic spectrum from the grid described above. For each observed spectrum, we fitted the radial velocity and parameters of the telluric components using spexxy and the best-fit synthetic spectrum to minimize the squared residuals between the model and observations. Figure 2 shows the radial velocities obtained this way. Table A.1 lists the observations dates, the radial velocities as well as their uncertainties, and the estimated S/N values.
To estimate the orbital parameters, we used an orbit model together with the nested sampling code ultranest (Buchner 2021). The free parameters of the Kepler model are the systemic velocity γ, the semi-amplitude K, the period p, the eccentricity e, the argument of periapse ω, and the mean anomaly ϕ at t0, where t0 is the time of the first observation.
We define our likelihood function L as
![Mathematical equation: \log L = - \frac{1}{2} \sum_i \frac{[v_i - v(t_i)]^2}{\sigma^2_{v,i}},](/articles/aa/full_html/2026/03/aa58594-25/aa58594-25-eq1.png) (1)
(1)
where vi and  are the observed radial velocities and their respective uncertainties, and v(ti) is the predicted velocity given the orbital parameters.
We could not directly compute the companion mass because the inclination of the system is unknown. For the Kepler case, a minimum companion mass (m2 sin i) can be numerically estimated from the orbital parameters using Murray & Correia (2010)
![Mathematical equation: m_2 \sin i = K \left[ \frac{p (m_1 + m_2)^2}{2 \pi G} \right]^{1/3} \sqrt{(1-e^2)}.](/articles/aa/full_html/2026/03/aa58594-25/aa58594-25-eq3.png) (2)
(2)
Table A.3 lists the priors used in the nested sampling analysis. In addition to a flat prior for the systemic velocity γ, we also computed solutions with a normal distribution centred on the cluster mean velocity with a standard deviation of 5 km/s, and a normal distribution centred on the mean observed radial velocity of NF1 B with a standard deviation of 20 km/s. The log-normal distribution used as period prior is based on results from N -body models in GCs from Ivanova et al. (2005, Nc = 105 case).
4 Results
4.1 Cluster membership
First, we verified that NF1 AB is a member of NGC 6397. We used the proper motions published in the HACKS dataset (Libralato et al. 2022). Its values are μα cos δ = 0.080 ± 0.076 mas/yr and μδ = 0.118 ± 0.122 mas/yr relative to the mean cluster motion. These values are well inside the bulk of the GC stars (see Fig. A.2) and thus indicate that NF1 AB is part of NGC 6397. In principle, the systemic velocity of the binary system can also verify the stars’ membership to the GC, but we leave this discussion to Sect. 5.4.
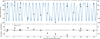 |
Fig. 2 Radial velocities of NF1 B observed in 2023 and predicted radial velocity curves computed from 100 parameter sets randomly drawn from the posterior. The residuals are computed relative to the median prediction. The first observation began on JD 2460082.68297265 (May 18, 2023, 4:23 UTC). |
4.2 Atmospheric and stellar parameters
The best fit to the MUSE spectrum with the synthetic WD spectra is illustrated in Fig. 1. We derive Teff = 16 140 K, log g = 5.72
  (cgs), and
  . The absence of He lines in the spectrum and the large uncertainty on the helium abundance derived essentially indicate an upper limit of log(NHe/Ntot) ≲ —2.5. Using the surface gravity and He abundance obtained from the spectral fit, we then proceeded with the SED fit. The resulting best fit is illustrated in Fig. 3. From the SED we obtain TeffSED = 16 220 ± 160 K and R = 0.109 ± 0.005 R⊙. We note here that the effective temperature derived from the SED is in perfect agreement with the spectroscopic value. From the given radius, we also derive L = 0.74 ± 0.07 L⊙ and lastly M = 0.23 ± 0.03 M⊙.
These parameters are consistent with an ELM WD nature, confirming that NF1 B, the visible component of the binary NF1 AB, is a low-mass He-core WD. However, the star has a surface gravity lower than most ELMs at this Teff, which have log g > 6.0 (Brown et al. 2020; Gianninas et al. 2014). Most low-gravity ELMs (log g < 6.0) are also referred to as proto-WDs, meaning that their temperature continues to increase and they have not yet entered their final cooling phase (see Sect. 2 of Istrate et al. 2016 and the evolutionary tracks displayed in Fig. 4).
4.3 Comparison with evolutionary models
The mass of NF1 B can also be estimated by comparing its atmospheric parameters, Teff and log g, to He-core WD evolutionary models of different masses and metallicities. We used the Istrate et al. (2016) evolutionary tracks, which predict log g and Teff during the evolution of low-mass He-core WDs at different metallicities. These models account for the effects of elemental diffusion and rotational mixing. NGC 6397 has [Fe/H] = —2.0 (Harris 1996, 2010 edition), corresponding to Z = 0.00014, which is comparable to the lowest metallicity (Z = 0.0002) considered in the models of Istrate et al. (2016).
Figure 4 shows the position of NF1 B in the log g-Teff and radius-Teff diagrams, along with the evolutionary tracks for the final cooling phase of He-core WDs. Among the tracks at Z = 0.0002, only the lowest-mass one (0.212 M⊙) passes through the parameter space represented in Fig. 4, but it predicts a higher Teff at both the log g and radius of NF1 B. To see evolutionary sequences at lower Teff, we need to use models computed with Z = 0.001. Although these have different metallicities, the tracks behave smoothly as mass decreases. Based on these tracks, we expect the mass of NF1 B to be close to 0.2 M⊙, which is in good agreement with the value estimated from the SED fit and the distance to the cluster. We note that the position of the cooling tracks is also affected by the mass of the hydrogen envelope remaining on the ELM WD. The thickness of the hydrogen envelope depends on whether the mass transfer was stable or unstable. A thick H-envelope forms in the former case, while a thin envelope is predicted by the latter (see e.g. Althaus et al. 2025). This introduces additional uncertainty in the mass determination from evolutionary tracks, which we estimate to be similar to that derived from the SED fit.
The star is located very close to the turn off point of the evolutionary tracks, meaning close to the maximum Teff reached by the models, and its position is consistent both in terms of log g and radius. We note that this agreement was not guaranteed, because log g was obtained from the spectral fit while the radius was obtained from the angular diameter. These two parameters do not strongly depend on the surface gravity.
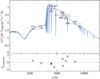 |
Fig. 3 SED fit to NF1 B. On the y-axis, we plot the flux fλ multiplied by λ2. The best-fit model is shown in grey, and the observed magnitudes in the various filters are indicated, along with their central wavelengths. The wavelength coverage of each filter is indicated with horizontal grey bars. Bottom: Uncertainty-weighted residuals χ = (magmodel-magobserved)/uncertainty. |
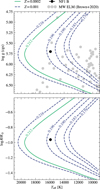 |
Fig. 4 Position of NF1 B in the log g-Teff diagram (top) and log R-Teff diagram (bottom) compared to selected model tracks including rotation and diffusion from Istrate et al. (2016). The labels along the tracks give the stellar mass in solar masses. The grey points represent the Milky Way ELMs from the Brown et al. (2020) survey. |
4.4 Orbital parameters
Using ultranest, the likelihood defined in Eq. (1), a Kepler orbit model, the priors in Table A.3 (including a flat prior on the systemic velocity), and the observed radial velocities, we find a unimodal solution with a period of 0.54351 ± 0.00003 d, a systemic velocity γ = 50.1 ± 4.1 km/s, a very low eccentricity e < 0.03, and semi-amplitude K = 202 ± 6 km/s (see Table 1). The distributions of these parameters (and others) are plotted in Fig. A.5 for different systemic velocity γ priors. We drew 100 samples from the posterior distribution obtained with the flat prior for the systemic velocity and calculated the predicted radial velocity curve for each sample. Figure 2 shows the individual radial velocity measurements and the 100 predicted radial velocity curves. The phase-folded data are shown in Fig. A.3. The residuals have a reduced χ2 = 3.7, indicating that the nominal radial velocity uncertainties do not account for the full variation observed in the velocities. The reported period uncertainty is very low, which is not unusual given the short period and the long observation time (see e.g. Brown et al. 2020).
With the orbital parameters from the posterior distribution and the mass from the visible He-core WD (see Sections 4.2 and 4.3), we estimated the mass of the unseen star using Eq. (2). Assuming an edge-on orbit (sin i = 1) and a mass of 0.23 ± 0.03 M⊙ for the He-core WD (NF1 B), we derive a minimum mass of 0.78 ± 0.06 M⊙ for NF1 A. For the other two γ priors, we find minimum masses of 0.74 ± 0.06 M⊙ (prior centred on the mean observed radial velocity) and 0.83 ± 0.06 M⊙ (prior centred on the mean cluster radial velocity).
Properties of the binary system NF1 AB.
5 Discussion
5.1 Data quality
Given the large residuals between the observed RVs and those predicted by our binary solution, we checked for data issues such as contamination by nearby sources or reduction problems. If contamination occurs due to crowding, the observed stellar spectrum becomes a combination of one or multiple other sources, and the stellar parameters derived from a contaminated spectrum are not representative of the observed star. Due to varying observing conditions, any potential contamination would also vary in influence and thus cause changes in apparent brightness. We checked for contamination by calculating magnitudes in the Bessel I, R, and V bands for each observed spectrum of NF1 AB. We measured the variation by calculating the standard deviation of the 19 observations in each band. NF1 AB has standard deviations of 0.19, 0.14, and 0.13 mag in the Bessel I, R, and V bands, respectively. In Fig. A.4, we compare these values to the median standard deviation of 187 stars with similar F606W magnitudes (±0.25 mag) as NF1 AB. These values are  mag,
mag,  mag, and
  mag for the same three bands, where the uncertainties represent the 1σ range of values obtained from the 187 comparison stars. We can conclude from these values that NF1 AB does not vary more than similarly bright stars. To check the reliability of our radial velocities, we chose nearby (≤5″) comparison stars with similar brightness (±0.25 mag in F606W) to NF1 AB. The finding chart (Fig. A.1) shows our five selected stars relative to NF1 AB (red circle). The reduced χ2 values of their radial velocities are 0.8, 1.0, 1.0, 1.1, and 1.4; see Fig. A.3 (bottom). We thus find that these stars show no significant variation in their radial velocities and conclude that the RVs we observe for NF1 B and their variation result neither from contamination by nearby stars nor from data reduction issues.
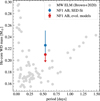 |
Fig. 5 Mass of NF1 B versus its orbital period, compared to ELM binaries in the Galactic field (Brown et al. 2020). |
5.2 Formation
The ELM systems in the Galactic field follow two distinct branches in the period-mass plane (Brown et al. 2020), as shown in Fig. 5. One branch comprises systems with short periods and a wide range of secondary (the He-core WDs) masses, which were likely formed following a common-envelope phase. A second branch contains systems with orbital periods that seem to increase proportionally with He WD mass. This branch is likely the result of Roche-lobe overflow (Li et al. 2019; Brown et al. 2020).
Given the mass of NF1 B, we show in Fig. 5 that the position of the system is consistent with the branch extending to longer periods and thus likely formed by Roche-lobe overflow. The system however lies slightly above this branch, especially when the mass derived from the SED fit is used. Observations of ELMs in the Milky Way (Brown et al. 2016) and simulations of ELM formation (Li et al. 2019) usually find or assume circular orbits, as we obtained for NF1 AB.
5.3 Nature of the invisible component
The invisible component has a minimum mass of 0.78 ± 0.06 M⊙. To estimate whether a low-luminosity main-sequence star could be the companion, we used a PARSEC (Bressan et al. 2012) isochrone that fits the CMD of NGC 6397. According to this isochrone, a main-sequence star with a mass of 0.6 M⊙ has a F606W magnitude of about 18.6 mag and would be slightly brighter than NF1 AB (see Table A.2). Therefore, any main-sequence companion would need a mass lower than 0.6 M⊙; however, this is ruled out by our orbital solution. Possible companion types are thus a WD or a neutron star. When we sample values of sin i to compute a distribution of inclination-corrected companion masses, we find that in about 35 to 40 % of all cases the companion has a mass above 1.45 M⊙ (i ≲ 50°), consistent with a neutron star. The closest known radio sources to NF1 AB are likely not associated with the system because they are located between 17″ and 20″ away (ATCA1, ATCA2, ATCA3 in Tudor et al. 2022).
5.4 Can a triple explain the large residuals?
As Fig. 2 shows, our best orbital solution produces large residuals starting 26 days after the first observation: about +50 km/s, gradually decreasing to about −50 km/s by day 36. These residuals cause a reduced χ2 of 3.7 for the overall fit, much higher than the expected value of about 1. Another peculiarity of the best orbital solution is the high systemic velocity ranging from 37.1 ± 3.1 km/s to 52.4 ± 4 km/s, depending on its prior. Given the mean cluster radial velocity of 18.51 ± 0.08 km/s (Baumgardt & Hilker 2018), the system has a relative radial velocity of at least 19 ± 3 km/s and proper motions of about 1 and 3 km/s, which in total is close to but below the central escape velocity of 21.5 km/s (Baumgardt & Hilker 2018). A possible explanation for the large residuals and the unusual systemic velocity is a third component. We fitted our measured RV data using the N-body integration code rebound (Rein & Liu 2012; Rein & Spiegel 2015) for a triple star system. We find bimodal solutions for all three systemic velocity priors, and all solutions have a lower reduced χ2 than the binary solution. For the flat prior and the normal prior centred on the mean of the observed RVs, we find either: a third component of 0.8 M⊙ with a period of 40 days, or a more massive star with a broad mass distribution (m3 > 0.8 M⊙) and a broad period distribution of more than 60 days. In both cases, the eccentricity of the third component is moderate to high (e > 0.4). For the normal prior centred on the average RV of the cluster, we find either: a third component with a period of 20 days, low eccentricity and a mass of 0.8 M⊙, or a more massive star (m3 > 1.4 M⊙) with a period of 60 days and low-to-moderate eccentricity (e < 0.4). The degree to which the systemic velocity γ of the triple solution is in agreement with the mean GC velocity also depends on the choice of the prior. For a normal prior centred on the mean of the observed RVs and with a dispersion of 5 km/s, we find γ ≈ 60 km/s and thus worse agreement with the GC systemic velocity. For a normal prior centred on the average RV of the cluster, we obtain γ ≈ 25 km/s, and the use of a flat prior results in γ ≈ 50 km/s. The use of a flat prior in the binary fit also results in a systemic velocity of about 50 km/s.
Simulations of GCs predict triple systems in both configurations: hierarchical triple systems with two WDs as the inner binary and either a WD or a neutron star as the outer companion. In these simulations, triples with a WD as the third component occur ten times more often than those with a neutron star (Fragione et al. 2020). However, the triple model likely overfits the data given the 19 observed RVs and the 12 free parameters from our triple model. To test this, we generated artificial RV data from our binary solution and added permuted residuals from the original binary fit as noise. This generated dataset can also be convincingly fitted with a triple star configuration. Although the triple star model has its advantages, we currently do not have enough data to confirm a third component in the NF1 AB system.
6 Conclusion
We presented a spectral analysis of NF1 AB, a binary containing a UV-bright ELM WD in NGC 6397. By combining 19 MUSE spectra to determine the spectroscopic properties of the visible component, we found an effective temperature of  K, a log g of
  (cgs), and a helium abundance below log(NHe/Ntot) = −2.5. Our fit to the star’s SED, based on HST photometry, the known distance, and reddening of the cluster, confirmed the Teff obtained from the spectra and allowed us to derive a stellar mass of 0.23 ± 0.03 M⊙, These properties are in good agreement with the evolutionary model tracks of He-core WDs, confirming previous photometric analyses (Cool et al. 1998; Strickler et al. 2009). The RV curve shows large variations with a semi-amplitude of about 200 km/s, confirming that NF1 is a binary system. After fitting it with a Kepler model, we determined that the orbit is essentially circular with a period of 0.5435 days. The unseen component, NF1 A, has a minimum mass of 0.78 ± 0.06 M⊙ and is thus heavier than the visible component. Since it neither contributes to the flux nor the spectrum of the system, it is a compact stellar remnant, most likely another WD or a neutron star if the inclination of the system is ≲50°. NF1 AB appears very similar to the ellipsoidal variable star V46 in NGC 6121 (Kaluzny et al. 1997, 2013). The visible component of V46 has atmospheric parameters very similar to those of NF1 B, implying equally low mass but a shorter orbital period of 0.0872 days, thus explaining the ellipsoidal variations caused by its compact companion (O’Toole et al. 2006).
Galactic ELM binary systems follow two distinct branches in the mass-period plane (e.g. Brown et al. 2020). By plotting NF1 AB in this plane, we find that it falls on the branch that most likely results from Roche-lobe overflow rather than a commonenvelope phase.
Our best fit for the orbital solution reproduced the observed RVs well, although some large (±50 km/s) residuals remained between day 26 and 36 (after the first observation). Thus, we tested whether a triple-system solution could reduce those residuals. We found that a third star with a period of either 20 or 80 days could explain the observed deviations, while the properties of the inner binary remain unchanged within their uncertainties. However, given the high number of free parameters in the triple-star model and the limited number of RV measurements, additional observations are needed to confirm a third body in this system.
The discovery of a double WD sheds light on the hidden population of faint WDs in GCs. A comprehensive survey of WDs and other remnants in binaries will enable us to further test predictions of GC evolution, in particular the high number of WDs in binaries predicted for this cluster’s core.
Acknowledgements
We thank the anonymous referee for their constructive comments. Based on observations collected at the European Organisation for Astronomical Research in the Southern Hemisphere under ESO programme(s) 0111.D-2117(A). F.G. and M.L. acknowledge funding from the Deutsche Forschungsgemeinschaft (grants DR 281/41-1, LA 4383/4-1). S.M. acknowledges funding from the Federal Ministry of Research and Technology (grant 05A23MGA).
SKA gratefully acknowledges funding from UKRI through a Future Leaders Fellowship (grants MR/T022868/1, MR/Y034147/1). We thank A. Irrgang and M. Dorsch for developing and maintaining the analysis tools used and S. Hämmerich for providing the grid of model atmospheres and synthetic spectra. This research has made use of NASA’s Astrophysics Data System Bibliographic Services.
References
- Althaus, L. G., Calcaferro, L. M., Córsico, A. H., & Brown, W. R. 2025, A&A, 699, A280 [NASA ADS] [CrossRef] [EDP Sciences] [Google Scholar]
- Anderson, J., Sarajedini, A., Bedin, L. R., et al. 2008, AJ, 135, 2055 [Google Scholar]
- Arnold, A. D., & Baumgardt, H. 2025, MNRAS, 537, 1807 [Google Scholar]
- Bacon, R., Accardo, M., Adjali, L., et al. 2010, in Ground-based and Airborne Instrumentation for Astronomy III, 7735, eds. I. S. McLean, S. K. Ramsay, & H. Takami (San Diego, California, USA), 773508 [Google Scholar]
- Baumgardt, H., & Hilker, M. 2018, MNRAS, 478, 1520 [Google Scholar]
- Bressan, A., Marigo, P., Girardi, L., et al. 2012, MNRAS, 427, 127 [NASA ADS] [CrossRef] [Google Scholar]
- Brown, W. R., Gianninas, A., Kilic, M., Kenyon, S. J., & Prieto, C. A. 2016, ApJ, 818, 155 [Google Scholar]
- Brown, T. M., Casertano, S., Strader, J., et al. 2018, Astrophys. Lett., 856, L6 [Google Scholar]
- Brown, W. R., Kilic, M., Kosakowski, A., et al. 2020, ApJ, 889, 49 [Google Scholar]
- Buchner, J. 2021, J. Open Source Softw., 6, 3001 [CrossRef] [Google Scholar]
- Cadelano, M., Chen, J., Pallanca, C., et al. 2020, ApJ, 905, 63 [NASA ADS] [CrossRef] [Google Scholar]
- Cool, A. M., Grindlay, J. E., Cohn, H. N., Lugger, P. M., & Bailyn, C. D. 1998, ApJ, 508, L75 [Google Scholar]
- Dattatrey, A. K., Yadav, R. K. S., Rani, S., et al. 2023, ApJ, 943, 130 [CrossRef] [Google Scholar]
- Edmonds, P. D., Grindlay, J. E., Cool, A., et al. 1999, ApJ, 516, 250 [Google Scholar]
- Fragione, G., Martinez, M. A. S., Kremer, K., et al. 2020, ApJ, 900, 16 [NASA ADS] [CrossRef] [Google Scholar]
- Gianninas, A., Dufour, P., Kilic, M., et al. 2014, ApJ, 794, 35 [NASA ADS] [CrossRef] [Google Scholar]
- Hansen, B. M. S., Kalogera, V., & Rasio, F. A. 2003, ApJ, 586, 1364 [Google Scholar]
- Harris, W. E. 1996, AJ, 112, 1487 [Google Scholar]
- Heber, U., Irrgang, A., & Schaffenroth, J. 2018, Open Astron., 27, 35 [Google Scholar]
- Husser, T.-O., Wende-von Berg, S., Dreizler, S., et al. 2013, A&A, 553, A6 [NASA ADS] [CrossRef] [EDP Sciences] [Google Scholar]
- Husser, T.-O., Kamann, S., Dreizler, S., et al. 2016, A&A, 588, A148 [NASA ADS] [CrossRef] [EDP Sciences] [Google Scholar]
- Irrgang, A., Przybilla, N., Heber, U., et al. 2014, A&A, 565, A63 [NASA ADS] [CrossRef] [EDP Sciences] [Google Scholar]
- Irrgang, A., Kreuzer, S., Heber, U., & Brown, W. 2018, A&A, 615, L5 [NASA ADS] [CrossRef] [EDP Sciences] [Google Scholar]
- Irrgang, A., Geier, S., Heber, U., et al. 2021, A&A, 650, A102 [NASA ADS] [CrossRef] [EDP Sciences] [Google Scholar]
- Istrate, A. G., Marchant, P., Tauris, T. M., et al. 2016, A&A, 595, A35 [NASA ADS] [CrossRef] [EDP Sciences] [Google Scholar]
- Ivanova, N., Belczynski, K., Fregeau, J. M., & Rasio, F. A. 2005, MNRAS, 358, 572 [NASA ADS] [CrossRef] [Google Scholar]
- Kaluzny, J., Thompson, I. B., & Krzeminski, W. 1997, AJ, 113, 2219 [Google Scholar]
- Kaluzny, J., Thompson, I. B., Rozyczka, M., & Krzeminski, W. 2013, Acta Astron., 63, 181 [Google Scholar]
- Kamann, S., Wisotzki, L., & Roth, M. M. 2013, A&A, 549, A71 [NASA ADS] [CrossRef] [EDP Sciences] [Google Scholar]
- Kamann, S., Husser, T.-O., Brinchmann, J., et al. 2016, A&A, 588, A149 [NASA ADS] [CrossRef] [EDP Sciences] [Google Scholar]
- Koester, D. 2010, Mem. Soc. Astron. Italiana, 81, 921 [NASA ADS] [Google Scholar]
- Kremer, K., Ye, C. S., Chatterjee, S., Rodriguez, C. L., & Rasio, F. A. 2019, Proc. Int. Astron. Union, 14, 357 [Google Scholar]
- Kremer, K., Rui, N. Z., Weatherford, N. C., et al. 2021, ApJ, 917, 28 [NASA ADS] [CrossRef] [Google Scholar]
- Latour, M., Hämmerich, S., Dorsch, M., et al. 2023, A&A, 677, A86 [NASA ADS] [CrossRef] [EDP Sciences] [Google Scholar]
- Li, Z., Chen, X., Chen, H.-L., & Han, Z. 2019, ApJ, 871, 148 [NASA ADS] [CrossRef] [Google Scholar]
- Libralato, M., Bellini, A., Vesperini, E., et al. 2022, ApJ, 934, 150 [NASA ADS] [CrossRef] [Google Scholar]
- Marsh, T. R., Dhillon, V. S., & Duck, S. R. 1995, MNRAS, 275, 828 [Google Scholar]
- Mata Sánchez, D., Istrate, A. G., van Kerkwijk, M. H., Breton, R. P., & Kaplan, D. L. 2020, MNRAS, 494, 4031 [CrossRef] [Google Scholar]
- Maíz Apellániz, J., Pantaleoni González, M., & Barbá, R. H. 2021, A&A, 649, A13 [NASA ADS] [CrossRef] [EDP Sciences] [Google Scholar]
- Murray, C. D., & Correia, A. C. M. 2010, in Exoplanets, The University of Arizona Space Science Series (Tucson, Ariz.: University of Arizona Press), 15 [Google Scholar]
- Nardiello, D., Libralato, M., Piotto, G., et al. 2018, MNRAS, 481, 3382 [NASA ADS] [CrossRef] [Google Scholar]
- O’Toole, S. J., Napiwotzki, R., Heber, U., et al. 2006, Baltic Astron., 15, 61 [NASA ADS] [Google Scholar]
- Pichardo Marcano, M., Rivera Sandoval, L. E., Maccarone, T. J., et al. 2025, ApJ, 979, 167 [Google Scholar]
- Piotto, G., Milone, A. P., Bedin, L. R., et al. 2015, AJ, 149, 91 [Google Scholar]
- Przybilla, N., Nieva, M.-F., & Butler, K. 2011, J. Phys. Conf. Ser., 328, 012015 [Google Scholar]
- Rein, H., & Liu, S.-F. 2012, A&A, 537, A128 [NASA ADS] [CrossRef] [EDP Sciences] [Google Scholar]
- Rein, H., & Spiegel, D. S. 2015, MNRAS, 446, 1424 [Google Scholar]
- Sarajedini, A., Bedin, L. R., Chaboyer, B., et al. 2007, AJ, 133, 1658 [Google Scholar]
- Soto, M., Bellini, A., Anderson, J., et al. 2017, AJ, 153, 19 [Google Scholar]
- Strickler, R. R., Cool, A. M., Anderson, J., et al. 2009, ApJ, 699, 40 [NASA ADS] [CrossRef] [Google Scholar]
- Tudor, V., Miller-Jones, J. C. A., Strader, J., et al. 2022, MNRAS, 513, 3818 [Google Scholar]
- Vitral, E., Kremer, K., Libralato, M., Mamon, G. A., & Bellini, A. 2022, MNRAS, 514, 806 [NASA ADS] [CrossRef] [Google Scholar]
- Weatherford, N. C., Kιroglu, F., Fragione, G., et al. 2023, ApJ, 946, 104 [NASA ADS] [CrossRef] [Google Scholar]
- Webbink, R. F. 1975, MNRAS, 171, 555 [Google Scholar]
- Weilbacher, P. M., Palsa, R., Streicher, O., et al. 2020, A&A, 641, A28 [NASA ADS] [CrossRef] [EDP Sciences] [Google Scholar]
We note that the available model grids for hydrogen-rich (DA) WDs only cover log g values higher than 6.5 or 7.0 (e.g. Koester 2010).
Appendix A Additional material
Observation start dates and radial velocities for the individual MUSE spectra (∆BJD is the Barycentric Julian date d −2460082 days).
HST-derived photometric magnitudes of NF1 AB.
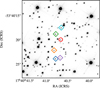 |
Fig. A.1 Finding chart (ACS-WFC F606W, Sarajedini et al. 2007; Anderson et al. 2008) of NF1 AB (red circle) in the centre of NGC 6397. All other marked stars are comparison stars (diamonds). The region shown is about 15 arcsec by 15 arcsec in size. |
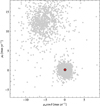 |
Fig. A.2 Relative proper motions of stars within the HST field of view centred on NGC 6397 (Libralato et al. 2022). The overdensity located at (0, 0) consists of GC members, the red dot is NF1 AB. |
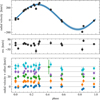 |
Fig. A.3 Phase-folded RV curve for NF1 AB (top), residuals (middle), and five close-by comparison stars (bottom, same colour-coding as Fig. A.1). For the RV curve of each comparison star, we add an offset and subtract the median RV. Note the different scales on the y-axis. |
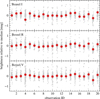 |
Fig. A.4 Brightness in three different filters computed from the MUSE spectra of NF1 AB (red circles) and 187 similarly bright stars relative to their respective median brightness as a function of observation. This plot includes the one observation which we omitted from the RV analysis due to low S/N. |
Priors used in the binary orbit modelling.
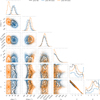 |
Fig. A.5 Corner plot of the binary orbit model for different prior choices of the systemic velocity γ. See Table A.3 for a description of the parameters. |
All Tables
Observation start dates and radial velocities for the individual MUSE spectra (∆BJD is the Barycentric Julian date d −2460082 days).
All Figures
|
Fig. 1 Best fit to the combined MUSE spectrum of NF1 AB. The observed spectrum combines 19 individual spectra with a total exposure time of 4.2 hours. |
| In the text | |
|
Fig. 2 Radial velocities of NF1 B observed in 2023 and predicted radial velocity curves computed from 100 parameter sets randomly drawn from the posterior. The residuals are computed relative to the median prediction. The first observation began on JD 2460082.68297265 (May 18, 2023, 4:23 UTC). |
| In the text | |
|
Fig. 3 SED fit to NF1 B. On the y-axis, we plot the flux fλ multiplied by λ2. The best-fit model is shown in grey, and the observed magnitudes in the various filters are indicated, along with their central wavelengths. The wavelength coverage of each filter is indicated with horizontal grey bars. Bottom: Uncertainty-weighted residuals χ = (magmodel-magobserved)/uncertainty. |
| In the text | |
|
Fig. 4 Position of NF1 B in the log g-Teff diagram (top) and log R-Teff diagram (bottom) compared to selected model tracks including rotation and diffusion from Istrate et al. (2016). The labels along the tracks give the stellar mass in solar masses. The grey points represent the Milky Way ELMs from the Brown et al. (2020) survey. |
| In the text | |
|
Fig. 5 Mass of NF1 B versus its orbital period, compared to ELM binaries in the Galactic field (Brown et al. 2020). |
| In the text | |
|
Fig. A.1 Finding chart (ACS-WFC F606W, Sarajedini et al. 2007; Anderson et al. 2008) of NF1 AB (red circle) in the centre of NGC 6397. All other marked stars are comparison stars (diamonds). The region shown is about 15 arcsec by 15 arcsec in size. |
| In the text | |
|
Fig. A.2 Relative proper motions of stars within the HST field of view centred on NGC 6397 (Libralato et al. 2022). The overdensity located at (0, 0) consists of GC members, the red dot is NF1 AB. |
| In the text | |
|
Fig. A.3 Phase-folded RV curve for NF1 AB (top), residuals (middle), and five close-by comparison stars (bottom, same colour-coding as Fig. A.1). For the RV curve of each comparison star, we add an offset and subtract the median RV. Note the different scales on the y-axis. |
| In the text | |
|
Fig. A.4 Brightness in three different filters computed from the MUSE spectra of NF1 AB (red circles) and 187 similarly bright stars relative to their respective median brightness as a function of observation. This plot includes the one observation which we omitted from the RV analysis due to low S/N. |
| In the text | |
|
Fig. A.5 Corner plot of the binary orbit model for different prior choices of the systemic velocity γ. See Table A.3 for a description of the parameters. |
| In the text | |
Current usage metrics show cumulative count of Article Views (full-text article views including HTML views, PDF and ePub downloads, according to the available data) and Abstracts Views on Vision4Press platform.
Data correspond to usage on the plateform after 2015. The current usage metrics is available 48-96 hours after online publication and is updated daily on week days.
Initial download of the metrics may take a while.