Open Access
Fig. A.4
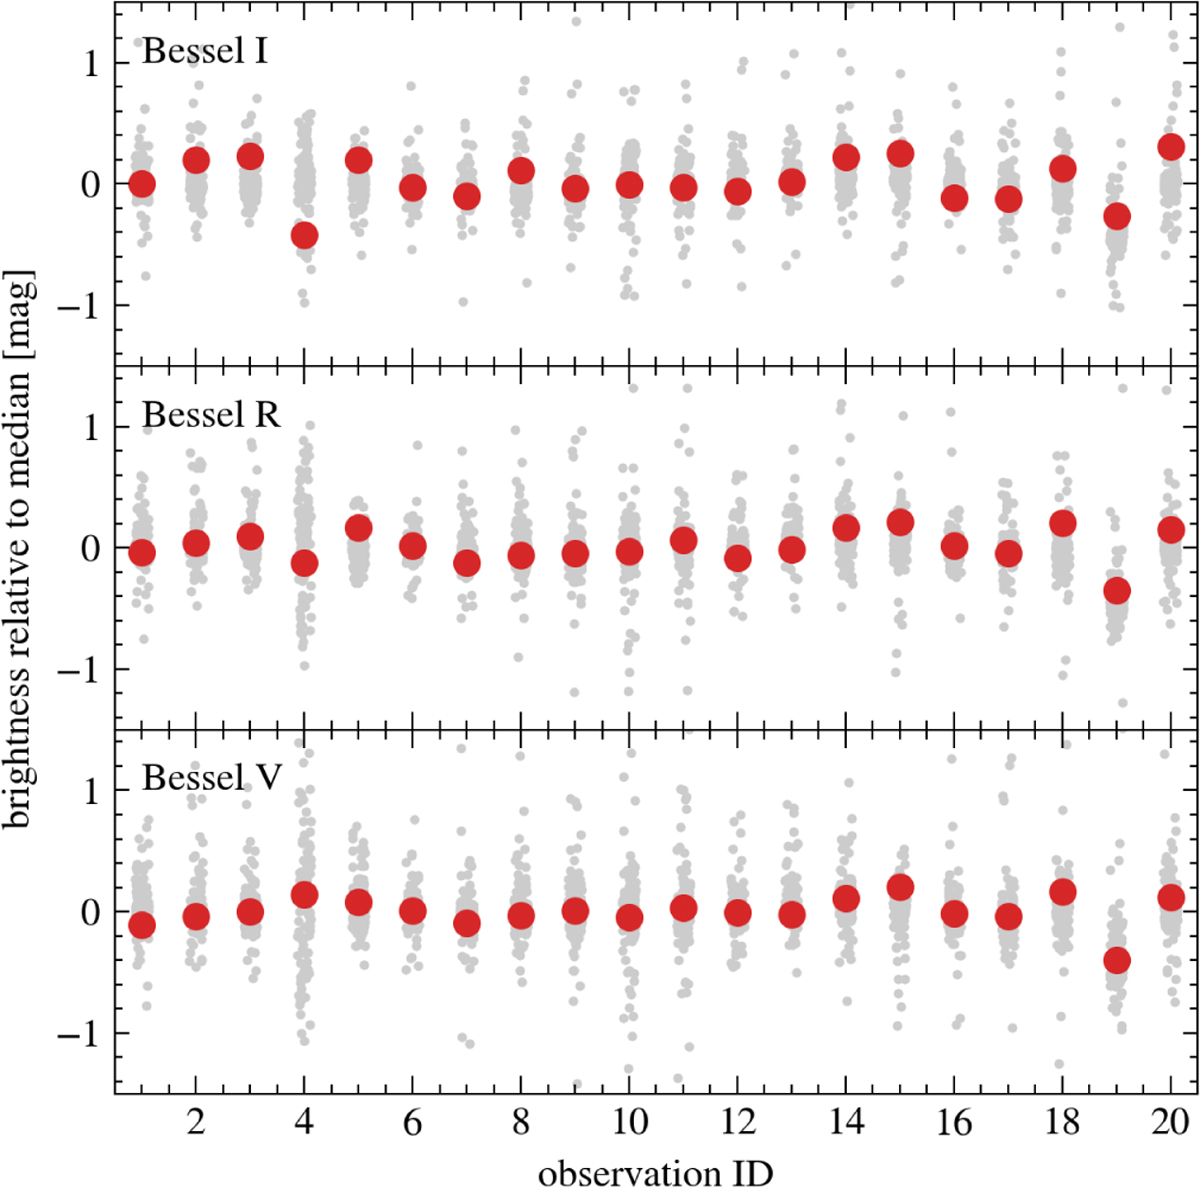
Download original image
Brightness in three different filters computed from the MUSE spectra of NF1 AB (red circles) and 187 similarly bright stars relative to their respective median brightness as a function of observation. This plot includes the one observation which we omitted from the RV analysis due to low S/N.
Current usage metrics show cumulative count of Article Views (full-text article views including HTML views, PDF and ePub downloads, according to the available data) and Abstracts Views on Vision4Press platform.
Data correspond to usage on the plateform after 2015. The current usage metrics is available 48-96 hours after online publication and is updated daily on week days.
Initial download of the metrics may take a while.