Fig. 1
Download original image
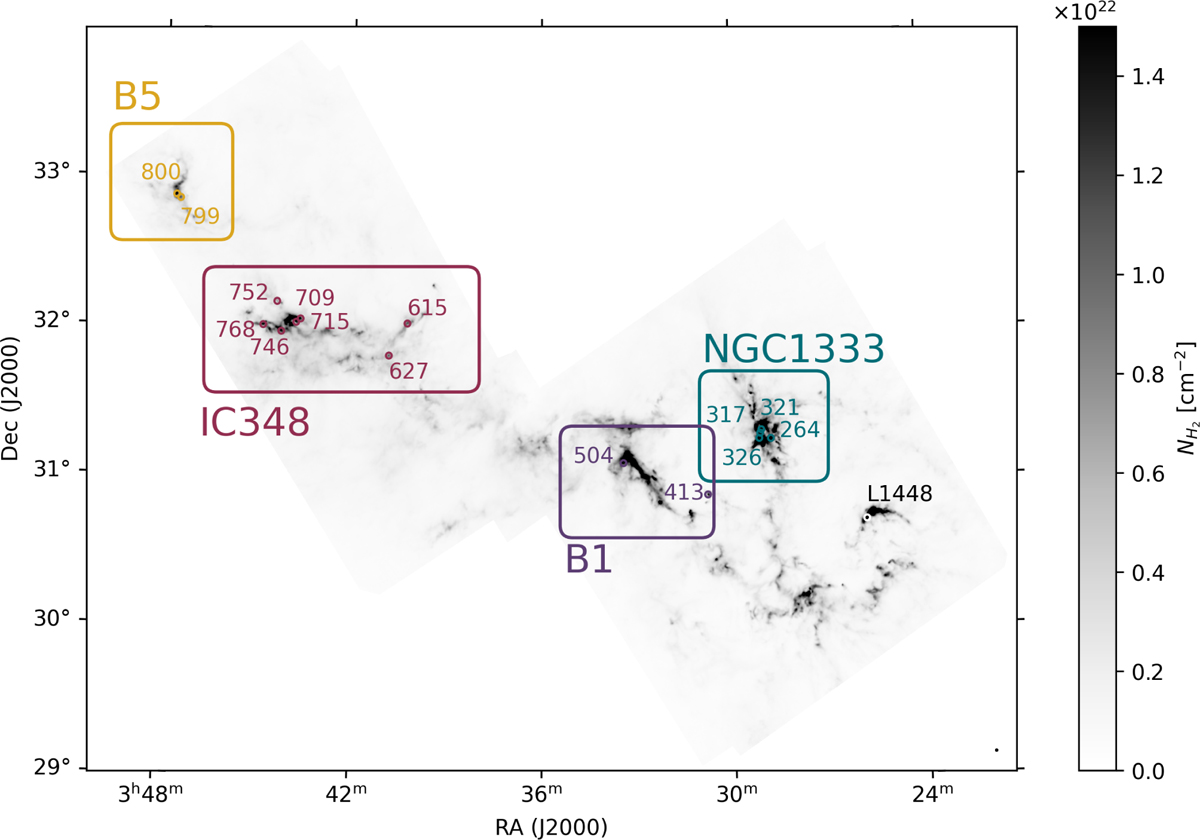
Molecular hydrogen column density (![]() ) map of the Perseus molecular cloud in grey scale (Pezzuto et al. 2012; Sadavoy et al. 2012, 2014). The starless and prestellar cores studied in this study are indicated by coloured circles corresponding to the regions within the molecular cloud where they are located. NGC1333 is plotted in teal, B1 in purple, IC348 in red, and B5 in yellow.
) map of the Perseus molecular cloud in grey scale (Pezzuto et al. 2012; Sadavoy et al. 2012, 2014). The starless and prestellar cores studied in this study are indicated by coloured circles corresponding to the regions within the molecular cloud where they are located. NGC1333 is plotted in teal, B1 in purple, IC348 in red, and B5 in yellow.
Current usage metrics show cumulative count of Article Views (full-text article views including HTML views, PDF and ePub downloads, according to the available data) and Abstracts Views on Vision4Press platform.
Data correspond to usage on the plateform after 2015. The current usage metrics is available 48-96 hours after online publication and is updated daily on week days.
Initial download of the metrics may take a while.