| Issue |
A&A
Volume 707, March 2026
|
|
|---|---|---|
| Article Number | A28 | |
| Number of page(s) | 22 | |
| Section | Interstellar and circumstellar matter | |
| DOI | https://doi.org/10.1051/0004-6361/202558604 | |
| Published online | 09 March 2026 | |
c-C3H2 deuteration towards prestellar and starless cores in the Perseus molecular cloud
1
RIKEN Cluster for Pioneering Research,
Wako-shi,
Saitama
351-0106,
Japan
2
National Radio Astronomy Observatory,
520 Edgemont Road,
Charlottesville,
VA
22903,
USA
3
Department of Astronomy, University of Virginia,
530 McCormick Rd,
Charlottesville,
VA
22904,
USA
4
Department of Astronomy, University of California,
Berkeley, Berkeley,
CA
94720,
USA
5
Steward Observatory, University of Arizona,
933 North Cherry Avenue,
Tucson,
AZ
85721,
USA
6
Centro de Astrobiología (CAB), CSIC-INTA,
Carretera de Ajalvir, km 4,
28805
Torrejón de Ardoz,
Spain
★ Corresponding author: This email address is being protected from spambots. You need JavaScript enabled to view it.
Received:
17
December
2025
Accepted:
19
January
2026
Abstract
Context. In cores deuterium fractionation becomes highly efficient due to low temperatures and CO freeze-out. Cyclopropenylidene (c-C3H2), a small cyclic molecule formed early in chemical evolution, and its deuterated forms serve as valuable tracers of gas-phase deuteration in these environments.
Aims. In order to statistically explore the c-C3H2 deuteration ratios towards starless and prestellar cores, we present observations of c-C3H2 and its deuterated isotopologues on a sample of cores in the Perseus molecular cloud.
Methods. Transitions of c-C3H2, c-C3HD, and c-C3D2 were observed with the Yebes 40m, the Arizona Radio Observatory (ARO) 12m and the Institut de Radioastronomie Millimétrique (IRAM) 30 metre telescopes towards a total of 16 starless and prestellar cores in the Perseus molecular cloud. The lines were fitted with Gaussian profiles and their column densities were computed using the non-local thermodynamic equilibrium (non-LTE) software RADEX.
Results. The main isotopologue c-C3H2 is detected in 93% (14/15) of the targeted cores (for one of the 16 cores, none of its transitions were covered), its singly deuterated form c-C3HD is detected in 94% (15/16) of the targeted cores, and its doubly deuterated form c-C3D2 is detected towards 56% (9/16) of the cores detected. A range of column densities towards the different cores was derived: for c-C3H2, (0.5–8.1)×1013 cm−2; for c-C3HD, (0.2–2.1)×1012 cm−2; and for c-C3D2, (0.6–1.6)×1011 cm−2. The ortho-to-para ratio of c-C3H2 was obtained for all except one core with a median value of 3.5 ± 0.4. The D/H and D2/D ratios were obtained for the cores with detections, yielding a statistically corrected D/H range of 0.5–9.2% with a median value of 1.5 ± 0.2% and a statistically corrected D2/D range 9.0–55.2% with a median value of 25.9 ± 4.3%.
Conclusions. No apparent trend is seen with the ortho-to-para ratio of c-C3H2 and the evolutionary stage of the core, as traced by volume density nH2. The median c-C3H2 D/H ratio in Perseus’ starless cores appears lower than the value for the Taurus molecular cloud and the Chamaeleon molecular cloud. The D2/D ratio is equivalent between the Perseus and Taurus molecular clouds within the uncertainties. There is a correlation with the D/H ratio and the nH2 of the cores in Perseus, strengthening the idea of D/H being a tracer of core evolution. The D2/D ratio does not correlate with nH2, but positively correlates with Tkin, suggesting that its formation is favoured by a slightly endothermic reaction.
Key words: astrochemistry / line: identification / stars: formation / ISM: abundances / ISM: clouds / ISM: molecules
Jansky Fellow of the National Radio Astronomy Observatory.
© The Authors 2026
 Open Access article, published by EDP Sciences, under the terms of the Creative Commons Attribution License (https://creativecommons.org/licenses/by/4.0), which permits unrestricted use, distribution, and reproduction in any medium, provided the original work is properly cited.
This article is published in open access under the Subscribe to Open model. This email address is being protected from spambots. You need JavaScript enabled to view it. to support open access publication.
1 Introduction
The deuterium to hydrogen ratio (D/H) in the local interstellar medium (ISM) is 2.0 ± 0.1 × 10⁻⁵ (Linsky 2003; Prodanović et al. 2010; Caselli et al. 2012; Ceccarelli et al. 2014). Locally, molecules can be enriched with deuterium, resulting in higher D/H ratios compared to the value observed in the local ISM. This process, known as deuterium fractionation, happens efficiently in prestellar cores. These cores, which represent the earliest stage of the star formation process, are gravitationally bound objects that show signs of contraction motions and are characterised by high volume densities ( ) and low temperatures (T < 10 K) at their centres (Bergin & Tafalla 2007; Keto & Caselli 2008). These are a subgroup of starless cores that are also defined as gravitationally bound objects but that do not show signs of contraction motions. The low temperatures favour the formation of bonds with deuterium over hydrogen due to the lower zero point energy (ZPE) of deuterium. Moreover, the two-way reaction involving one of the main deuteration agents in the gas phase, H2D+ –
 (1)
– is shifted to the right-hand side because at low temperatures the backwards reaction is quenched (Pagani et al. 1992). This is due to the exothermicity of the reaction and the H2 ortho-to-para (otp) ratio being low in prestellar cores (<0.01; Pagani et al. 2009; Dislaire et al. 2012) compared to its statistical value of 3. The higher energy of ortho-H2 with respect to para-H2 can overcome the reaction barrier, destroying H2D+ in favour of
(1)
– is shifted to the right-hand side because at low temperatures the backwards reaction is quenched (Pagani et al. 1992). This is due to the exothermicity of the reaction and the H2 ortho-to-para (otp) ratio being low in prestellar cores (<0.01; Pagani et al. 2009; Dislaire et al. 2012) compared to its statistical value of 3. The higher energy of ortho-H2 with respect to para-H2 can overcome the reaction barrier, destroying H2D+ in favour of  . Furthermore, as the temperatures decrease towards the centre of the core and with the contraction of the core, the main destructor of H2D+, CO, is frozen onto the surface of dust grains. All of these conditions increase the
  ratio. Then, the H2D+ can transfer the deuterium atom to other molecules.
Prestellar cores contract with time, which lowers the temperature at the centre as well as increases the area of CO freeze out. Thus, colder and longer-lived prestellar cores will present higher deuterium fractionation ratios as well as multi-deuterated molecules compared to warmer and shorter-lived ones. This was inferred from modelling methanol (CH3OH) deuteration in prestellar cores using observed D/H and D2/D ratios towards low- and high-mass protostellar sources (van Gelder et al. 2022). Thus, the D/H and D2/D molecular ratios are a great tool to better understand the characteristics of the prestellar core nature.
Nevertheless, because of the low temperatures of starless and prestellar cores, studying the deuteration of molecules larger than methanol is challenging due to low abundances. Even doubly deuterated methanol has only been reported in the literature for three cores (Lin et al. 2023; Scibelli et al. 2025). This is why in this work we explore the deuterium fractionation in starless and prestellar cores by focusing on the deuteration of a smaller molecule, cyclopropenylidene (c-C3H2) towards the Perseus molecular cloud.
c-C3H2 is a small organic molecule detected towards multiple sources at different stages of the star formation process such as diffuse clouds, starless and prestellar cores, circumstellar envelopes, hot corinos, planetary nebulae, and outflow cavities (Thaddeus et al. 1985; Cox et al. 1988; Madden et al. 1989; Lucas & Liszt 2000; Martínez-Henares et al. 2025). Its deuterated forms have also been detected towards the ISM (Bell et al. 1986; Gerin et al. 1987; Spezzano et al. 2013; Majumdar et al. 2017). Deuterated cyclopropenylidene has only been detected towards a select number of prestellar cores in Taurus: Gerin et al. (1987); Spezzano et al. (2013); Gratier et al. (2016); Chantzos et al. (2018); Giers et al. (2022) and in Chamaeleon: Lis et al. (2025). c-C3H2 is mainly formed by the radiative recombination of  in the gas phase (Loison et al. 2017). c-C3HD and c-C3D2 are formed from the successive deuteration of the main isotopologue, also in the gas phase (Spezzano et al. 2013). The singly and doubly deuterated c-C3H2 abundances towards the L1544 prestellar core can be reproduced by chemical models only using gas-phase reactions (Spezzano et al. 2013). This makes c-C3H2 a unique tracer for gas-phase only deuteration in contrast to, for example, methanol, which is thought to form uniquely on the surface of grains (Watanabe & Kouchi 2002; Osamura et al. 2004; Watanabe et al. 2005; Fuchs et al. 2009; Hidaka et al. 2009).
Perseus is one of the nearest (∼294 ± 17 pc; Zucker et al. 2018) and most extensively studied molecular clouds in the solar neighbourhood. Covering a total area of about 74 pc2 (Evans et al. 2009), the cloud extends roughly 10 pc across the sky and exhibits a velocity gradient with local standard of rest (LSR) velocities (vLSR) ranging from 4.5 to 10 km s−1, possibly indicating the superposition of multiple cloud components (Arce et al. 2010). Perseus is a low-mass star-forming region that hosts a rich population of young stellar objects (YSOs), including about 100 dense cores and over 400 YSOs, of which approximately 50 are classified as Class 0 and Class I protostars (Yang et al. 2021). The cloud contains two main protostellar clusters, NGC 1333 and IC 348, along with other regions of active star formation such as B5, B1, L1448, and L1455. This region harbours a large number of low-mass pre-main-sequence stars, embedded proto-stars, and starless or prestellar cores (e.g. Ladd et al. 1993; Aspin et al. 1994; Lada & Lada 1995; Hatchell et al. 2005; Enoch et al. 2006; Kirk et al. 2006; Muench et al. 2007; Gutermuth et al. 2008; Evans et al. 2009). In particular, NGC 1333 exhibits numerous active molecular outflows, making it one of the most dynamically young and active subregions within the cloud. Recent chemical surveys of embedded protostars in Perseus, conducted with the Nobeyama telescope, have detected species such as C2H, c-C3H2, and CH3OH, revealing possible correlations between source location and the CH3OH/C2H ratio, which may reflect environmental influences on the chemical composition of these protostellar systems (Higuchi et al. 2018). Scibelli et al. (2024) surveyed 35 starless and prestellar cores in the Perseus molecular cloud with the ARO 12 m telescope, detecting methanol (CH3OH) and acetaldehyde (CH3CHO) in 100% and 49% of the sample, respectively. Follow-up Yebes 40 m observations revealed several additional complex organic molecules (COMs), showing that such species are already widespread in the cold gas preceding star and planet formation in Perseus. In this work we continue the chemical survey of the starless and prestellar cores of the Perseus molecular cloud, focusing on c-C3H2 and its deuterated isotopologues.
This study is structured as follows: the observations are presented in Section 2, the description of the methodology used to reduce and fit the data are presented in Section 3, the results are presented in Section 4, these results are interpreted in Section 5, and we summarise the conclusion in Section 6. Moreover, supplementary information is collected in the appendix.
2 Observations
Single pointing observations of c-C3H2, c-C3HD, and c-C3D2 towards 15 Perseus cores were taken by two different telescopes: the Yebes Observatory 40m telescope and the Arizona Radio Observatory (ARO) 12m telescope. Additionally, supplemental data from the Institut de Radioastronomie Millimétrique 30 metre telescope (IRAM 30m) was used for one additional core, bringing the total number of cores to 16 (Figure 1, Table 1). All of the transitions targeted are presented in Table 2.
The data taken by the Yebes 40m telescope were first presented in Scibelli et al. 2024. These observations were taken between 2022 and 2023, corresponding to the projects with ID 22A022 and 23A025 (PI: Scibelli). The 15 Perseus cores targeted were selected on the basis of the detection of acetaldehyde (CH3CHO) to search for other COMs. These cores were observed with the Q-band wide-band receiver (Tercero et al. 2021) with a bandwidth of 18.5 GHz in the 31.5 – 50 GHz frequency range. The resolution of the observations is of 38.0 kHz (0.38 km s−1 – 0.23 km s−1). The beam ranges between 36″ and 56″ across the full frequency range. The data were reduced and converted to the main beam temperature (TMB) using the publicly available Python-based scripts1 developed by Megías et al. (2023), which calls on the Continuum and Line Analysis Single-dish Software (CLASS), an application from the GILDAS2 software (Pety 2005). For further information on the data and on the reduction process, refer to Scibelli et al. (2024).
Moreover, to add additional transitions, we observed c-C3H2 and c-C3HD transitions using the ARO 12-m Radio Telescope on Kitt Peak (PI: Steffes). Observations occurred over 46 shifts from February 21, 2025 through June 15, 2025 using absolute position switching for 30 seconds on and off source for 5 minute scans. Using the multi-window mode on AROWS, we observed two transitions of para-c-C3H2, these being the 22,0–11,1 (150.44 GHz) and the 40,4- 31,3 (150.820665 GHz) transitions. Then, we observed two transitions of ortho-c-C3H2, these being the 41,4–30,3 (150.85 GHz) and the 31,2–22,1 (145.09 GHz) transitions. Finally, we observed two transitions of c-C3HD. These were the 41,4–30,3 (136.370909 GHz) and 22,0–11,1 (137.454464 GHz) transitions. After applying Hanning smoothing, the velocity resolution ranged over 0.08–0.09 km s−1 with a frequency resolution of 39.06 kHz. These observations had a beam size ranging from 41″ to 46″.
The length of the ARO 12m observations was determined by the amount of time required for each to achieve a signal-to-noise ratio (S/N) ≥ 5. Because of the use of multi-window mode, this resulted in many observations achieving a S/N > 5 as we stayed on source in a given set-up until the weakest transition achieved a S/N of 5. Several sources were simply too weak to achieve this sensitivity within the given time. Linear functions were then fitted to all of the velocity channels not within the 5σ boundaries of the Gaussian. All of these observations were summed, weighted by 1/σ2 (with σ being the root mean square (RMS) noise level), and fitted with a Gaussian using CLASS. These were then subtracted from the summed spectra to baseline them. The average beam efficiency for the 2mm frequency range of 81% was applied.
Additionally, we are including one c-C3HD and one c-C3D2 transition observed towards another prestellar core in the Perseus molecular cloud, L1448. These observations were carried out with the Institut de Radioastronomie Millimétrique 30 metre telescope (IRAM 30m) within the project with ID IRAM 071-23 (PI: Fuente, Kulterer et al. 2026). The observations were carried out on May 2 and 3, 2024 in excellent weather (PWV = 0–4.6 mm, τ < 0.1) and at a system temperature (Tsys) of 60–130 K. EMIR with the FTS backend and a spectral resolution of 49 kHz was used. The data were taken in frequency-switching mode with a frequency throw of 3.9 MHz. Of the four original spectral windows, those centred on 93.6 and 106.1 GHz, with RMSs of 2.13 and 2.20 mK, respectively, were used. The half power beam width (HPBW) of c-C3HD 303–202 is 23″ and the one for the c-C3D2 303–212 transition is 26″.
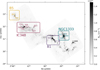 |
Fig. 1 Molecular hydrogen column density ( |

Starless and prestellar cores in the Perseus molecular cloud targeted in this study.
Observed molecular transitions.
3 Analysis
The observations were fitted with the Python ‘pyspeckit’ package (Ginsburg & Mirocha 2011; Ginsburg et al. 2022). For three transitions, c-C3H2 32,1–31,2, c-C3D2 11,1–00,0 for the core Per799, c-C3D2 11,1–00,0 for the core Per627, the fit resulted in anomalously large errors for the VLSR and the full width at half maximum (FWHM). The limited spectral resolution of the Yebes 40m observations, which ranges between 0.23 and 0.38 km s−1 compared to the 0.08–0.09 km s−1 of the ARO 12m and 0.14–0.16 km s−1 of the IRAM 30m observations, does not allow one to resolve these lines, which appear narrower than the rest. For these three transitions, the area under the line was directly derived from the spectra with a Python routine, and then by assuming a fixed line width, the peak temperatures are calculated and printed in Tables A.1 and A.3 alongside an asterisk (*). A transition is considered detected if its peak temperature is ≥3σ. The c-C3H2 and c-C3HD isotopologues are considered detected towards a core if multiple transitions were detected. In the case of c-C3D2, we consider that if the main and D-isotopologues have been detected towards a specific core, and we have detected c-C3D2 transition at least once, this isotopologue is also detected.
For the derivation of the column density, it should be noted that both c-C3H2 and c-C3D2 have ortho and para states. Because the interconversion timescales within these states are long, ortho and para states can be treated as separate molecules. Thus, the total column density of c-C3H2 is the column density of ortho-c-C3H2 plus the column density of para-c-C3H2. The same applies to c-C3D2. For more information, refer to Section 4.1.
The column densities for the different isotopologues were calculated using the RADEX code (van der Tak et al. 2007). RADEX is a non-local thermodynamic equilibrium (non-LTE) radiative transfer code that requires physical information about the source, volume density ( ), and kinetic temperature (Tkin), as well as spectral and collisional rate information of the molecule to model its transitions.
The input  and the Tkin used to model the line intensity and subsequently constrain column densities (see Table 1) are based on the median values for Herschel maps (Pezzuto et al. 2021) within the ARO 12m 62″ beam. The data analysed in this study has different beam sizes owing to the use of different telescopes and different targeted frequencies. We took the derived volume densities listed in Scibelli et al. (2024) as their value does not significantly change when considering the different beam sizes in this study (see Appendix B). Additionally, we computed the
  value for L1448 also with a Herschel map using a 62″ beam, for comparison purposes. The Tkin values for different cores are constrained from NH3 observations, except for Per615 for which the Herschel Tdust is reported (see Scibelli et al. (2024) for details). The Tkin for L1448 was derived from far-infrared and sub-millimetre observations (Zari et al. 2016; Rodríguez-Baras et al. 2021).
For the three transitions for which the pyspeckit fitting was not possible, the area extracted under the line was used alongside an assumed linewidth (0.5 km s−1) to derive the line intensity. A 10% uncertainty was assumed for both  and Tkin (see Scibelli et al. 2024). The column density values do not vary significantly for a sensible range of
  and Tkin (for more information see Appendix B). The column density for each molecule (ortho-c-C3H2, para-c-C3H2, c-C3HD, ortho-c-C3D2, and para-c-C3D2) was adjusted minimising the χ2 value. Uncertainties were estimated using a Monte Carlo approach in which the observed line parameters,
  and Tkin, were randomly perturbed within their respective uncertainties, and the RADEX fit was repeated for each trial. Lastly, the total column densities were calculated for c-C3H2 by summing the ortho and para column densities. In the case of c-C3D2, no ortho and para transitions were observed towards the same source simultaneously, so a statistical otp ratio value of 2 was used to compute the total column densities (see Section 4.1).
Finally, to explore possible correlations between the physical parameters of the cores and the derived column densities, otp ratios, and D/H and D2/D ratios, we employed the Pearson correlation coefficient (r), which statistically measures the linear relationship between two variables.
4 Results
The parameters resulting from the Gaussian fitting of the observed c-C3H2, c-C3HD and c-C3D2 towards all of the cores (TMB, VLSR, FWHM, and RMS) can be found in Appendix A. The fitting of the transitions towards the Perseus cores can be seen in Figures 2, 3, and 4, except for the core L1448, which is plotted in Figure 5. The number of detected transitions for each of the isotopologues towards each source is summarised in Table 3, and the total detection statistics, including detected, non-detected, and non-targeted, are shown with pie charts in Figure 6.
The column densities for each of the isotopologues towards each of the cores, calculated following the method described in Section 3, are summarised in Table 4.
The results for each of the isotopologues, c-C3H2, c-C3HD, and c-C3D2, are discussed in Sections 4.1, 4.2, 4.3, respectively. Moreover, the c-C3H2 otp ratio and its deuteration ratios are presented in Sections 4.1 and 4.4.
The plots related to c-C3H2, c-C3HD and c-C3D2 are plotted consistently throughout this study in blue, green, and orange, respectively.
4.1 c-C3H2
For c-C3H2 a total of six lines were targeted: two at lower frequencies with the Yebes 40m telescope, 321–312 (o) and 211–202 (p); and four at higher frequencies with the ARO 12m telescope, 220–111 (p), 404–313 (p), 312–221 (o), and 414–303 (o). The additional ARO 12m observations were done a posteriori to have multiple ortho and para transitions with different Eup, so as to better constrain the excitation temperature and column density of c-C3H2. This molecule was not targeted towards L1448.
Out of the 15 cores where our data covers c-C3H2, we detected the molecule towards 14 (∼93%). The S/N calculated from the line peak temperature ranges from 3 to 86 for the detected transitions. The only core where c-C3H2 was not detected is Per752.
Note that some lines observed with the ARO 12m telescope towards Per709 have profiles that deviate from a Gaussian. This line profile is resolved for some of the transitions observed with the ARO 12m telescope, but not for the transitions observed with the Yebes 40m telescope, owing to their different spectral resolutions. The origin of this double-peaked line profile is unknown. Because this profile is only marginally resolved in a few transitions, we do not attempt to model it. We note that this introduces some additional uncertainty in the column densities derived towards Per709.
The 32,1–31,2 ortho transition could not be modelled with RADEX for core Per413. The c-C3H2 32,1–31,2 transition has quite a high upper energy (Eup ∼30 K) compared to the other ortho transitions. Per413 is the core where c-C3H2 is the most abundant (Figure C.1 in Appendix C). Thus, in Per413 this transition may be tracing warmer gas from the envelope at different  and Tkin, and thus could not be fitted alongside the other ortho transitions. This transition was excluded from the column density calculation for Per413.
The column density of c-C3H2 was calculated using the method described in Section 3. The column densities for the ortho- and para-c-C3H2 were computed separately, as they have different collisional rate coefficients. The main isotopologue rate coefficients are given in Ben Khalifa et al. (2019), while the ones for the deuterated isotopologues are given in Ben Khalifa et al. (in prep.). These obtained values were summed to give the total-c-C3H2 column density that we present in Table 4. For the core Per752, as c-C3H2 was not detected, we give an upper limit column density. This core was exclusively observed with the Yebes 40m data, and thus the upper limit column density was estimated with just the 32,1–31,2 and 21,1–20,2 transitions. A line width of 0.5 km s−1 was assumed. The total c-C3H2 column density values found range from 5.0 ± 1.0×1012 cm−2 (Per317) to 8.1 ± 1.8×1013 cm−2 (Per413), with a weighted average of 8.6 ± 0.5×1012 cm−2 (not taking into account the upper limit of Per752).
The ortho-c-C3H2 excitation temperatures (Tex) returned by RADEX are very similar amongst transitions and cores with a median of 3.7 K. The situation is similar for para-c-C3H2, where the Tex has a median of 3.5 K. The optical depth (τ) of c-C3H2 changes for the different transitions. For 32,1–31,2, τ has a median of 0.08, for 21,1–20,2 the median τ is 0.14, for 22,0–11,1 it is 0.73, for 40,4–31,3 it is 0.32, for 31,2–22,1 the median is 0.83, and for 41,4–30,3 the median is 1.27.
Molecules with symmetry that have two equivalent protons (or H atoms) exhibit two different type of states: ortho and para. These different states arise from the orientation of the two protons’ spin directions. Ortho corresponds to nuclear wavefunctions that have a total spin of Itot = 1 and are symmetric to interchange of the protons. Para nuclear wavefunctions have Itot = 0 and are antisymmetric to interchange of the protons. The interconversion between ortho and para is low, due to the weakness of the nuclear magnetic interaction, which makes it possible to treat ortho and para states as two different molecules.
The c-C3H2 molecule has two equivalent protons, which consequentially results in a separation of ortho and para states. The spin of the hydrogen atom is ± 1/2. If we take into account the relation between the spin of the atom and the total spin of the molecule, Itot = |I1–I2|, … , I1 + I2, where I1,2 are the nuclear spin of each atom, the total nuclear spin of c-C3H2 can be either 0 or 1. Knowing that the number of individual states is given by 2Itot + 1, then for Itot = 0 we get one state and for Itot = 1 we get three states. In this case Itot = 0 corresponds to the para states and Itot = 1 corresponds to the ortho states. Then, statistically, the otp ratio of c-C3H2 is 3. Due to its symmetry, for c-C3H2, the states that have quantum numbers Ka and Kc such that Ka + Kc = odd will be ortho and the states that have Ka + Kc = even will be para. This is why for example the 321–312 transition (see Table 2) is an ortho transition. Nevertheless, the otp ratio can be non-statistical due to the physical conditions of the environment. For example, the H2 otp ratio is seen to be lower than 3 in prestellar cores (<0.01; Pagani et al. 2009; Dislaire et al. 2012) due to the low temperatures present. The protons in the c-C3HD molecule are not equivalent, and thus do not present ortho and para sub-states. On the other hand, the protons in c-C3D2 are equivalent and this molecule will show separate ortho and para states. The spin in the case of deuterium is 1. Following the same reasoning as for c-C3H2, the Itot = 0, 1, 2, with a number of states equal to 1, 3, and 5, respectively. In the case of c-C3D2, Itot = 0 and 2, accounting for six symmetric nuclear wavefunctions, are ortho, and Itot = 1, accounting for three anti-symmetric wavefunctions, are para. Thus, the statistical ratio of c-C3D2 is 2. Due to the symmetry of c-C3D2, the states that have Ka + Kc = odd value will be para and the ones that have that have Ka + Kc = even will be ortho. Notice that the Ka + Kc rule is opposite for the c-C3H2 and c-C3D2 molecules. As neither ortho-nor para-c-C3D2 was detected towards the same cores, this otp ratio could not be studied.
Three ortho and three para-c-C3H2 transitions have been detected towards each of the cores (except for Per752 and L1448), which allows us to obtain otp ratios for 14 cores. The ortho-c-C3H2 column density is divided by the para-c-C3H2 column density. The otp ratios are listed in Table 5. In Figure 7, the otp ratios and its errors are plotted for the different cores in blue. The median value of 3.5 ± 0.4 is plotted with a dashed grey line and with a grey band, respectively. The median uncertainty was calculated with the bootstrap method, which is a statistical resampling technique used to estimate the uncertainty of measured parameters.
All of the cores present a statistical otp ratio of 3 within the errors, except for core Per799, which has a higher otp ratio: 4.7 ± 1.6.
The c-C3H2 otp ratio has been plotted against the volume density and kinetic temperature of the cores with the aim of finding possible correlations (Figure 8, right and left panels respectively). No correlations have been found for the otp ratio with either  or Tkin (r = –0.20 and –0.34, respectively). No trends have been found either for the otp ratio regarding the cloud subregion.
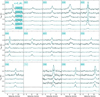 |
Fig. 2 Observed spectra of the c-C3H2 transitions organised by core number. All of the transitions for the same core are plotted in the same subplot with vertical offsets for clarity. The Gaussian fit from pyspeckit are overplotted with a blue line. The spectra without a Gaussian fit indicate a non-detection. Core number labels with a colour background indicate c-C3H2 has been detected towards the source. Lastly, horizontal dashed grey lines indicate 3σ levels. |
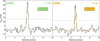 |
Fig. 5 Observed spectra and the Gaussian fit from pyspeckit of c-C3HD, in green, and c-C3D2, in orange. Horizontal dashed grey lines indicate 3σ levels. |
Number of detected transitions per isotopologue and core.
4.2 c-C3HD
For c-C3HD a total of five lines were targeted: three at lower frequencies with the Yebes 40m telescope, 211–202, 101–000, and 111–000; one at intermediate frequencies with the IRAM 30m telescope, 303–202; and two at higher frequencies with the ARO 12 m telescope, 414–303 and 220–111. The observed lines with their Gaussian fits from pyspeckit are plotted in Figures 3 and 5 for source L1448.
c-C3HD is detected towards 15/16 cores (∼94%). The only core where c-C3HD was not detected is Per752. The column density values can be found on Table 4, except for Per752, for which we give upper limits. The Per752 core was exclusively observed with the Yebes 40 m data, and thus the upper limit column density in this case was estimated just with the 21,1–20,2, 10,1–00,0, and 11,1–00,0 transitions. A line width of 0.5 km s−1 was assumed. For cores Per264, Per317, Per321, Per326, Per709, Per715, and Per800, transition 11,1–00,0 is badly fitted by RADEX, giving unexpected high Tex values. Thus, this transition was excluded from the fit towards these cores. The c-C3HD column density values found range from 2.0 ± 0.3×1011 cm2(Per317) to 1.9 ± 0.2×1012 cm2 (Per800), with a weighted average of 4.0 ± 0.1×1011 cm2 (not taking into account the upper limit of Per752).
The median of Tex is 8.4 K for 21,1–20,2, 5.6 K for 10,1–00,0, 12.8 K for 11,1–00,0, 4.9 K for 41,4–30,3, and 4.6 K for 22,0–11,1. The optical depth (τ) does not change much within transitions with a median of 0.02.
4.3 c-C3D2
For c-C3D2 a total of three lines were targeted: two at lower frequencies with the Yebes 40 m telescope, 211–202 (o) and 111–000 (o); and one at intermediate frequencies with the IRAM 30m telescope, 303–212 (p). The observed lines with their Gaussian fits from pyspeckit are plotted in Figures 4 and 5, for source L1448.
c-C3D2 was detected towards 9/16 cores (∼56%). The cores where c-C3D2 is not detected are Per264, Per317, Per326, Per615, Per709, Per752, and Per768. There is not a perfect correlation between the cores with the highest c-C3HD column densities and c-C3D2 detections. For example, c-C3D2 has not been detected towards Per326, one of the cores with the highest c-C3HD column densities.
All of the detected c-C3D2 transitions are ortho except for one para transition detected towards L1448. As we do not have both ortho- and para-c-C3D2 for the same cores, we assume a statistical otp ratio of 2 (see Section 4.1) to calculate the total c-C3D2 column densities. The total-c-C3D2 column densities can be found on Table 4, except for Per264, Per317, Per326, Per615, Per709, Per752, and Per768, for which we give upper limits. For these cores c-C3D2 was exclusively targeted with the Yebes 40m data, and thus the upper limit column density in this case was estimated with the 21,1–20,2 and 11,1–00,0 transitions. As these are ortho transitions, the total column density upper limit was calculated assuming an otp ratio of 2. As for the other molecules, a line width of 0.5 km s−1 was assumed. RADEX is not able to find a solution for the para 30,3–21,2 transition observed towards L1448. As there is just one c-C3D2 transition targeted towards L1448, we calculated the column density of the molecule by assuming an excitation temperature of 5 K, as RADEX found a Tex of ∼6 K for c-C3HD towards the same source. The c-C3D2 column density values found range from 5.8 ± 1.6×10¹⁰ (Per715) to 1.6 ± 0.2×10¹¹ (Per800), with a weighted average of 9.9 ± 0.7×10¹⁰ (not taking into account the upper limits of nondetections).
The excitation temperature (Tex) of c-C3D2 transitions tends to be higher than that of the other isotopologues. The Tex value derived for the 11,1–00,0 transition is on average larger than for 21,1–20,2, with medians of 13.6 and 8.2 K. The median τ for 11,1– 00,0 of all cores is 0.004 and for 21,1–20,2 it is 0.002.
4.4 c-C3H2 deuteration ratios
The c-C3HD/c-C3H2 (D/H) ratio has been obtained towards all of the cores except towards Per752, where neither c-C3H2 nor c-C3HD were detected, and L1448, as we do not have data covering c-C3H2 transitions. The c-C3D2/c-C3HD (D2/D) ratio is obtained towards nine cores, including Per321, Per413, Per504, Per627, Per715, Per746, Per799, Per800, and L1448 (see Table 4).
Two types of deuteration ratios are given: the direct ones where the column densities of the isotopologues are divided, and the corrected ones that take into account statistical corrections. We used the statistical correction formula taken from Appendix C of Drozdovskaya et al. (2022). To calculate the  from the c-C3HD/c-C3H2 ratio, we employed the following equation:
 (2)
where n are the equivalent H atom positions and i is the number of deuteriums. If we substitute and solve for the statistically corrected ratio
(2)
where n are the equivalent H atom positions and i is the number of deuteriums. If we substitute and solve for the statistically corrected ratio  , we get
 (3)
which indicates that the ratio of the c-C3HD/c-C3H2 column densities needs to be multiplied by 1/2. Using the formula
(3)
which indicates that the ratio of the c-C3HD/c-C3H2 column densities needs to be multiplied by 1/2. Using the formula
 (4)
where j is the number of deuteriums in the other isotopologue, we see that to obtain
(4)
where j is the number of deuteriums in the other isotopologue, we see that to obtain  we need to multiply c-C3D2/c-C3HD by a factor of 2.
With the aim of comparing these deuteration ratios with other molecules, we use the statistically corrected values in the discussion.
The c-C3H2 D/H ratios range from 0.5 to 9.2%, with a median value of 1.5 ± 0.2%. The core with the lowest D/H ratio is Per768 and the one with the highest is Per326. The c-C3H2 D2/D ratios range from 9.0 to 55.2%, with a median value of 25.9 ± 4.3%. The core with the lowest detected ratio is Per413 and the one with the highest is Per715.
To explore the possible correlations of deuteration with the physical properties of cores, the D/H and D2/D ratios are plotted against the  and Tkin (see Figures 9 and 10, respectively). A correlation is found between the D/H ratio and the
  of the cores, with a correlation coefficient of 0.94, indicating that the D/H ratio is indeed higher for denser cores (Figure 9, right panel). On the other hand, there is no correlation found for D/H versus Tkin (r = 0.12, Figure 9, left panel). Contrary to the D/H ratio, D2/D presents no correlation with
  (r = –0.24, Figure 10, right panel), but it shows a correlation with Tkin (r = 0.65, 10, left panel). Finally, plotting D/H against D2/D does not give a strong correlation (r = –0.39, Figure 11).
 |
Fig. 6 Detection statistics of c-C3H2, in blue, c-C3HD, in green, and c-C3D2, in orange. The pie chart shows three categories: detected, not detected (ND), and not targeted (NT). c-C3H2 and c-C3HD were not targeted towards one of the cores, while C3D2 was targeted towards all of them. |
Obtained column densities and D/H and D2/D ratios.
5 Discussion
c-C3H2 has been detected towards the entire subset of cores, except for Per752, for which an upper column density limit is given. Per752 is the core with the lowest volume density of the cores studied in this paper. This, in combination with the slightly larger Tkin, could result in insufficient emission being detected with the sensitivity of the current observations. However, other molecules, including COMs, such as CH3OH, CH3CHO, CH3CN, t-HCOOH, and H2CCO, have been detected towards this core (Scibelli et al. 2024). Thus, the c-C3H2 non-detection towards Per752 appears to be directly related to this specific molecule instead of this core being generally chemically poor. In Pokorny-Yadav et al., (in prep.), carbon chains were specifically surveyed in the same starless and prestellar core selection towards the Perseus molecular cloud. In the above-mentioned study, Per752 presents almost no carbon chain detections, which is in agreement with the non-detection of c-C3H2 in this study. Thus, Per752 is particularly poor in carbon chain molecules, suggesting that the physical characteristics and environment of this core are favourable for the production of COMs but not of carbon chains (see Pokorny-Yadav et al., (in prep.)).
Obtained c-C3H2 otp ratios along the studied cores.
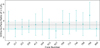 |
Fig. 7 c-C3H2 otp ratios and their uncertainties are plotted for each core in blue. The median otp value as well as its standard deviation for each of the cores (3.5 ± 0.4) are plotted with a horizontal dashed grey line and grey band, respectively. The statistical value of 3 is marked by a horizontal solid blue line. |
5.1 c-C3H2 otp ratio
The statistical ortho to para ratio of c-C3H2 is 3 (see Section 4.1). However, this ratio can deviate from the statistical value due to different factors such as the initial non-statistical otp ratio of the reactants and interconversion ratio reactions (Furuya et al. 2015; Lupi et al. 2021).
Observational studies have explored the otp ratio of c-C3H2 towards TMC-1 (Madden et al. 1989; Takakuwa et al. 2001; Morisawa et al. 2006) and L1527 (Takakuwa et al. 2001). These studies showed that the otp ratio towards prestellar cores can deviate from the statistical value. Morisawa et al. (2006) find a direct correlation between the core’s evolutionary stage, as measured with the NH3/CCS abundance ratio, and its otp ratio, with lower otp ratios observed towards younger cores. However, the gas-phase chemical modelling of the otp ratio of c-C3H2 done in Park et al. (2005), which includes otp interconversion reactions, is not able to reproduce the observed ratios in Morisawa et al. (2006). Nevertheless, they claim observational uncertainties or the incompleteness of the reaction network could have impacted the results. Thus, the correlation between the otp ratio and the evolutionary stage of the core is not confirmed.
The otp ratios of c-C3H2 studies are limited to TMC-1 and L1527. In this study, we expand these observations to the Perseus molecular cloud to understand whether the deviation of the otp ratio also happens in other starless and prestellar cores.
As is seen in Section 4.1, all of the cores except for one have a statistical otp ratio of 3 within uncertainty. The median otp ratio of the core sample is 3.5 ± 0.4. Due to the limited sensitivity of the observations, the uncertainties or the otp ratios are large, and possible non-statistical ratios towards other cores are not seen. Due to the possibility of c-C3H2 otp ratios deviating from its statistical value of 3, as was seen in previous works (Madden et al. 1989; Takakuwa et al. 2001; Morisawa et al. 2006) and as is hinted at in this one, calculating total c-C3H2 column densities from either only the ortho- or para-c-C3H2 column densities by assuming an otp ratio of 3 is not always safe. If possible, both ortho- and para-c-C3H2 transitions should be observed to get an accurate total c-C3H2 column density. Plotting otp ratios against  and Tkin does not give any trends (with correlation coefficients of –0.20 and –0.34 in Figure 8, right and left panels, respectively). If we assume a direct relationship between the core volume density and its evolutionary stage, contrarily to Morisawa et al. (2006), we do not see a trend of increasing otp ratios with evolutionary stage (Figure 8). The absence of a trend could be due to the uncertainties related to the derived otp ratios. However, the c-C3H2 otp ratios may also be determined by many more variables other than the core evolutionary stage, making the c-C3H2 otp ratio an unreliable proxy for the core evolutionary stage.
5.2 c-C3H2 deuteration
c-C3HD, as its main isotopologue, is detected towards all of the cores in the sample except Per752. On the other hand, c-C3D2 is detected towards a smaller number of cores (Per321, Per413, Per504, Per627, Per715, Per746, Per799, and Per800). To test whether the cores where c-C3D2 is detected could be the cores with highest D/H ratios, we plotted the D/H ratios against the D2/D ones, but no clear trend was seen (r = –0.39, Figure 11).
Plotting the c-C3H2 D/H and D2/D ratios against the volume density ( ) of the cores shows a direct correlation between D/H and
  (r = 0.94, Figure 9, right panel) but no correlation for D2/D and
  (r = –0.24, Figure 10, right panel). D/H scaling with
  agrees with the idea that the more evolved cores, which are denser, are the ones that present higher deuteration ratios. Nevertheless, in Chantzos et al. (2018) they do not find a correlation between the D/H ratio and the central column densities of Taurus starless and prestellar cores. If Per326 is removed from the Perseus correlation then a Pearson correlation coefficient of 0.76 is obtained. If both the Per326 and Per321 cores are removed then a Pearson correlation coefficient of 0.42 is obtained. If instead the Spearman rank correlation coefficient (ρ), which measures the strength and direction of a monotonic relationship between two variables, is used, the value 0.64 is obtained. The correlation found between D/H and
  seems to be governed by these two more massive cores. On the other hand, the D2/D ratio does not appear to follow this trend. This could be due to the fact that the detection sample spans a narrower range in volume densities compared to the D/H ratio. Nevertheless, the D2/D ratio not correlating with volume density may point to the independence of the second deuteration of c-C3H2 from density, unlike the D/H ratio.
The c-C3H2 D/H and D2/D ratios were also plotted against the kinetic temperature (Tkin) of the cores, as it is known that low temperatures enhance deuterium fractionation (Figures 9 and 10, respectively). No clear trend is observed for the D/H ratio, but there is a positive correlation for the D2/D one. The lack of correlation between D/H and Tkin may be due to the fact that Tkin does not necessarily represent the temperature of the inner part of the core where deuterium fractionation is enhanced. This is supported by the lack of correlation (r = 0.15) between  and Tkin (Figure 12), which would be expected if Tkin represented the temperature at the centre of the core, which would decrease with increasing
  . The positive correlation of D2/D with Tkin could be explained if the second deuteration happened at least partly in the gas phase through slightly endothermic reactions, as for example is the case with CH2D+.
c-C3H2 is thought to be formed in the gas phase mainly by the electron recombination of  (Loison et al. 2017). The formation of its deuterated isotopologues is thought to occur through the deuteration of its main isotopologue with H2D+, D2H+, and
  , followed by an electron recombination (Spezzano et al. 2013). In this scenario, the deuteration fraction increases with time, owing to the cores getting lower temperatures at their centre due to their increasing densities, and the H2D+ molecule being formed more efficiently. This is seen in our results, in which the D/H ratio directly correlates with the core volume density. On the other hand, we see that the D2/D ratio does not correlate with
  but positively correlates with Tkin. This seems to indicate that the second deuteration of c-C3H2 is enhanced by a slightly endothermic reaction. Then when Tkin is higher it favours these type of reactions, resulting in higher D2/D ratios. A reaction with CH2D+ is thought to become the main deuteration path at warm temperatures (≳30 K), as the formation mechanism of CH2D+ is slightly more endothermic than the formation mechanism of H2D+. It is possible then, that at the ‘warmer’ external layers of the cores, traced by Tkin, deuteration reactions with CH2D+ start being relevant. There is also the possibility that other slightly endothermic reactions are responsible for the higher D2/D ratios observed towards warmer cores in the Perseus molecular cloud. Follow-up work would be needed to assess this scenario in greater detail.
The larger D2/D ratio compared to the D/H one indicates that the second deuteration, from c-C3HD to c-C3D2, is more effective than the first deuteration from c-C3H2 to c-C3HD. This phenomenon, whereby the second deuteration is more effective than the first one, has been observed in other molecules. For example, observations towards the prestellar core L1544 show that D2CS is relatively more abundant than HDCS, indicating enhanced second deuteration of thioformaldehyde (Spezzano et al. 2022). Studies of formaldehyde towards the protostellar system IRAS 16293-2422 reveal a higher D2CO/HDCO ratio than for HDCO/H2CO (Jørgensen et al. 2018); similarly, the amidogen radical in the same source exhibits unexpectedly high ND2/NHD ratios, suggesting efficient multiple deuteration during prolonged cold prestellar phases (Melosso et al. 2020). This trend has also been observed for some COMs in IRAS 16293-2422 and the neighbouring prestellar core IRAS 16293E (Scibelli et al. (2025), for D2/D in methanol). The COMs in IRAS 16293-2422 display an average D2/D ratio of ∼20%, which is generally four times higher than their D/H ratios (Manigand et al. 2020; Richard et al. 2021; Drozdovskaya et al. 2022; Ferrer Asensio et al. 2022). These results point at least to the partial inheritance of these molecules from the prestellar phase, where the conditions favour deuterium fractionation. This is confirmed by the methanol D/H and D2/D ratios derived from the prestellar core IRAS 16293E (Scibelli et al. 2025), which formed in the same environment as the protostellar system IRAS 16293-2422.
It needs to be taken into account that some c-C3H2 transitions are optically thick, τ > 1, towards some cores, Per413, Per504, Per627, Per768, Per799, and Per800. This means that some D/H ratios could be enhanced as the column density of c-C3H2 would be underestimated. Nevertheless, these cores are not the densest cores that seem to be dominating the trend.
In Pokorny-Yadav et al., (in prep.) they have studied the deuteration of HC3N across the same group of Perseus starless and prestellar cores, finding a D/H ratio ranging between 1.8% (Per326) and 12.4% (Per321), with a median of 6.4%. In the case of c-C3H2, the core with the lowest D/H ratio is Per768 (0.5%), and the one with the highest is Per326 (9.2%), with a median of 1.5%. From these results we see that the formation of the singly deuterated species for HC3N is more efficient than the one for c-C3H2. Pokorny-Yadav et al., (in prep.) have found a correlation with the volume density of the cores, similar to the one found for the D/H ratio of c-C3H2 in the present study (Figure 12 in Pokorny-Yadav et al., in prep.). Nevertheless, in the case of HC3N, Per326 and Per264 do not follow the trend, having lower D/H ratios. This behaviour is attributed to the local environment of the cores Per326 and Per264 affecting the deuteration of HC3N. These cores are located on the path of the outflows of the SVS13, IRAS 4A/B, and IRAS 2A/B protostars. They suggest that shocks produced by the outflow impacts may release CO from dust grains, lowering the abundance of gas-phase deuteration molecules such as H2D+. Contrary to what is found for HC3N, the c-C3H2 D/H ratio of cores Per264 and Per326 follow the positive correlation with  . This difference may come from the different chemical nature of the two molecules and their reactivity. Lastly, the HC3N D/H median found towards the Perseus starless and prestellar cores in Pokorny-Yadav et al. (in prep.) is consistent with D/H values measured in other prestellar and protostellar cores in Taurus and Serpens.
Moreover, the deuteration of H2S, H2CS, and CH3OH has also been studied towards some starless and prestellar cores in the Perseus molecular cloud. The deuteration of H2S has been studied towards ten Perseus starless and prestellar cores, alongside cores in Taurus and Orion, in Rodríguez-Baras et al. (2023). HDS has been detected towards seven cores, while D2S has been detected towards four cores. The D/H and D2/D ratios derived towards the sample are higher than the ratios derived for c-C3H2 in this study. The deuteration of H2CS is studied towards ten starless and prestellar cores in Perseus, in addition to other sources in Taurus and Orion. HDCS is detected towards seven cores, while D2CS is detected towards five sources. The derived deuteration H2CS ratios appear higher than the ones found for c-C3H2 in this study. The higher deuteration ratios of H2CS with respect to c-C3H2 were also observed towards the prestellar core L1544 (Spezzano et al. 2022). The D/H ratio of CH3OH has been studied towards L1448 in Kulterer et al. (2026), also giving a higher value than the median D/H found in Perseus for c-C3H2. In general, previous studies have shown that H2CS and H2CO exhibit higher deuteration ratios towards starless and prestellar cores than c-C3H2, H2S, H2O, and CH3OH, which highlights the diversity in deuteration fractionation mechanisms for different molecules.
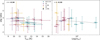 |
Fig. 8 Ortho-to-para ratios plotted against the kinetic temperature (left panel) and volume density (right panel) of the cores. The cores belonging to different regions within the Perseus molecular cloud are plotted with different colours (NGC1333 in teal, B1 in purple, IC348 in red, and B5 in yellow). The x-axis in the right panel is plotted in logarithmic scale for clarity. The dashed grey line indicates the linear correlation trend between the two variables. In the top left corner, the Pearson correlation coefficient is displayed. |
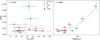 |
Fig. 9 D/H ratios plotted versus the kinetic temperature (left panel) and volume density (right panel) of the cores. The cores belonging to different regions within the Perseus molecular cloud are plotted with different colours. The x-axis in the volume density plot is plotted in logarithmic scale for clarity. The dashed grey line indicates the linear correlation trend between the two variables. The Pearson correlation coefficient is displayed on the top left. |
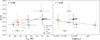 |
Fig. 10 D2/D ratios plotted versus the kinetic temperature (left panel) and volume density (right panel) of the cores. The cores belonging to different regions within the Perseus molecular cloud are plotted with different colours. The x-axis in the volume density plot is plotted on a logarithmic scale for clarity. The dashed grey line indicates the linear correlation trend between the two variables. The Pearson correlation coefficient is displayed on the top left. |
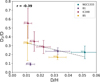 |
Fig. 11 D2/D ratios plotted versus the D/H ratios. The cores belonging to different regions within the Perseus molecular cloud are plotted with different colours. The dashed grey line indicates the correlation trend between the two variables. In the top left corner, the correlation coefficient is displayed. |
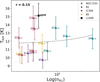 |
Fig. 12 Kinetic temperatures of clouds plotted against their volume densities. The x-axis is plotted on a logarithmic scale for clarity. The cores belonging to different regions within the Perseus molecular cloud are plotted with different colours. The dashed grey line indicates the correlation trend between the two variables. In the top right corner, the correlation coefficient is displayed. |
 |
Fig. 13 Statistically corrected D/H and D2/D ratios percentages for c-C3H2, in purple and orange, respectively, for the sources in the Perseus molecular cloud (this study, circles), and additional sources in the Chamaeleon molecular cloud, Cha-C2 (Lis et al. (2025), cross), and the Taurus molecular cloud, shaded in grey: CB23, L1400A, L1495, L1495AN, L1495AS, L1495B, L1512, L1517B, TMC2 (Chantzos et al. (2018), triangles), TMC-1C (Spezzano et al. (2013), square), and L1544 (Giers et al. (2022), diamond). The horizontal dashed purple and orange lines and bands indicate the median with standard deviation for the D/H and D2/D for the Perseus and the Taurus cores separately. For the Chamaeleon molecular cloud, just one source, Cha-C2, is reported, so no median is given. Instead the value of the corrected D/H ratio is plotted. |
5.2.1 Comparison with the Taurus and Chamaeleon molecular clouds
The c-C3H2 D/H and D2/D ratios have been derived towards other starless and prestellar cores in previous works. Most of these target cores in the Taurus molecular cloud, except one work that derives the D/H value towards the prestellar core Cha-C2 in the Chamaeleon molecular cloud (Lis et al. 2025). Thus, a comparison of the deuteration of c-C3H2 in starless and prestellar cores between the Perseus, Taurus, and Chamaeleon molecular clouds can be made. The data for Taurus was taken from Spezzano et al. (2013), Chantzos et al. (2018), and Giers et al. (2022). As the prestellar core L1544 appears in the three papers, we use the c-C3H2 D/H and D2/D ratios derived from the latest work (Giers et al. 2022). The ratios in these papers have not been statistically corrected. Thus, for comparison purposes, we applied the same statistical factors used in this study (see Section 4.4).
All the ratios are plotted in statistically corrected percentages (Figure 13). For each singly and doubly deuterated ratio and molecular cloud, a median value with uncertainties was computed. The uncertainties were computed with the same method used to calculate the otp ratio median uncertainty, and are plotted with horizontal dashed lines and bands. The Perseus median D/H value is 1.5 ± 0.2%, and the D2/D median value is 25.9 ± 4.3%. The Taurus median D/H value is 4.8 ± 0.5% and the D2/D median value is 19.6 ± 3.4%. As for Chamaeleon there is just one measurement instead of the median, the corrected D/H value (12%) is given. The cores in Taurus have a larger c-C3H2 D/H ratio compared to the Perseus ones. The Cha-C2 prestellar core has a D/H value higher (12%) than the sources both in Perseus and Taurus. If the correlation between D/H and  is also present in the Taurus and Chamaeleon molecular clouds, the higher D/H ratio of Taurus and Chamaeleon (Cha-C2) compared to the one in Perseus would make sense as the cores in Taurus and in Chamaeleon have a higher median
  (1.4 × 1053 and 5.5 × 105 cm−3, Chantzos et al. (2018); Belloche et al. (2011)) compared to the cores in Perseus. The D2/D ratios are equivalent between the Perseus and Taurus molecular clouds. These results show that there is greater variation of D/H and D2/D ratios among cores within the same molecular cloud than among the medians of different molecular clouds. This suggests that the local environment of the cores has a greater effect on the deuteration of c-C3H2 than the parent molecular cloud they are located in.
5.2.2 Comparison with protostars
Besides studying the c-C3H2 deuteration towards starless and prestellar cores towards the Taurus molecular cloud, Chantzos et al. (2018) also studied c-C3HD and c-C3D2 towards some protostellar sources in the Taurus (L1521F) and Perseus (Per5, IRAS03282, HH211 and L1448-IRS2) molecular clouds. The mean derived D/H ratio towards the protostellar sources in the Perseus molecular cloud is 7 ± 1%, derived taking into account all Perseus sources mentioned above, and the D2/D ratio is 34 ± 6%, derived from Per5 and HH211. These ratios take into account statistical corrections. The protostellar D/H median is higher than the starless and prestellar one derived in this study. This is likely due to the prestellar core that evolved into the observed protostars being longer lived than the starless and prestellar cores studied in this study. The protostellar D2/D median is also higher than the one for starless and prestellar cores, but they agree within errors. They derived D/H and D2/D ratios towards the L1521F protostellar core (very low-luminosity object, or VeLLO) in the Taurus molecular cloud of 4 ± 2% and 16 ± 4%. These ratios agree within errors with the mean values derived for starless and prestellar cores in Taurus. The protostellar D/H and D2/D ratios generally agree or are higher than the observed starless and prestellar ratios, suggesting at least a partial inheritance of the c-C3H2 budget, and supporting the idea that the deuterium fractionation increases throughout the prestellar core phase.
6 Conclusions
This work has presented new c-C3H2, c-C3HD, and c-C3D2 observations towards starless and prestellar cores towards the Perseus molecular cloud taken with the Yebes 40m, ARO 12m, and IRAM 30m telescopes. c-C3H2 and c-C3HD are detected towards all targeted cores except for Per752. c-C3D2 is detected towards 56% (9/16) of the targeted cores.
The otp ratio of c-C3H2 has been studied, leading to a median value of 3.5 ± 0.4 for all targeted cores. All targeted cores but the one of Per799 (with a value of 4.7 ± 1.6) have a statistical otp ratio within the uncertainties. No correlation has been found between c-C3H2 otp ratios and the evolutionary stage of the core, traced by  .
.
The median statistically corrected c-C3H2 D/H and D2/D ratios derived from the observations are 1.5 ± 0.2% and 25.9 ± 4.3%, respectively. No correlation has been found between D/H and D2/D ratios. On the other hand, D/H ratios positively correlate with the core’s volume density. This supports the idea that more evolved, and therefore denser, cores present higher levels of deuteration. The D2/D ratios positively correlate with Tkin, suggesting that, while the first deuteration is dependent on volume density, the second deuteration is dependent on Tkin and may happen through slightly endothermic reactions. The median D/H ratio in Perseus is lower than the one observed in cores towards the Taurus molecular cloud and the core observed towards the Chamaeleon molecular cloud. This could be attributed to the cores in the latter molecular clouds having higher  than the ones in Perseus. When it comes to D2/D, even if the median found in Perseus is larger than in Taurus, they are equivalent when taking uncertainties into account.
The variation in D/H and D2/D ratios among cores is larger than the variation in their medians among molecular clouds, suggesting that the local environment of the cores has a greater impact on the deuteration of c-C3H2 than the parent cloud itself.
Acknowledgements.
J. Ferrer Asensio thanks RIKEN Special Postdoctoral Researcher Program (Fellowships) for financial support. S. Scibelli acknowledges the National Radio Astronomy Observatory which is a facility of the National Science Foundation operated under cooperative agreement by Associated Universities, Inc. L. Steffes is supported by a National Science Foundation Graduate Research Fellowship Program under Grant № [DGE-2137419]. Any opinions, findings, and conclusions or recommendations expressed in this material are those of the authors and do not necessarily reflect the views of the National Science Foundation. L. Steffes and Y. Shirley are also supported by the National Science Foundation Astronomy and Astrophysics Grant (AAG) AST-2205474. We are thankful to have the oportunity to conduct astronomical research on Iolkam Du’ag (Kitt Peak) in Arizona and we recognise and acknowledge the significant cultural role and reverence that these sites have to the Tohono O’odham Nation. We sincerely thank the operators of the Arizona Radio Observatory (Kevin Bays, Patrick Fimbres, Blythe Guvenen, and Ryan Buchta) for their assistance with observations. The 12m Telescope is operated by the Arizona Radio Observatory (ARO), Steward Observatory, and the University of Arizona, with funding from the State of Arizona, NSF MRI Grant AST-1531366 (PI: Ziurys), NSF MSIP Grant SVS-85009 / AST-1653228 (PI: Marrone), NSF CAREER Grant AST-1653228 (PI: Marrone), and a PIRE Grant DISE-1743747 (PI: Psaltis). I. Jiménez-Serra and A. Megías acknowledge funding from the ERC grant OPENS (project number 101125858) funded by the European Union, and from the grant PID2022-136814NB-I00 funded by the Spanish Ministry of Science, Innovation and Universities / State Agency of Research, MCIU/AEI/10.13039/501100011033 and by “ERDF/EU”. A. Taillard acknowledge funding from the European Research Council under the European Union’s Horizon 2022 research and innovation program (grant agreement No. 101096293 SUL4LIFE).
References
- Arce, H. G., Borkin, M. A., Goodman, A. A., Pineda, J. E., & Halle, M. W. 2010, ApJ, 715, 1170 [NASA ADS] [CrossRef] [Google Scholar]
- Aspin, C., Sandell, G., & Russell, A. P. G. 1994, A&AS, 106, 165 [Google Scholar]
- Bell, M. B., Feldman, P. A., Matthews, H. E., & Avery, L. W. 1986, ApJ, 311, L89 [Google Scholar]
- Belloche, A., Parise, B., Schuller, F., et al. 2011, A&A, 535, A2 [NASA ADS] [CrossRef] [EDP Sciences] [Google Scholar]
- Ben Khalifa, M., Sahnoun, E., Wiesenfeld, L., et al. 2019, Phys. Chem. Chem. Phys. (Incorp. Faraday Trans.), 21, 1443 [Google Scholar]
- Bergin, E. A., & Tafalla, M. 2007, ARA&A, 45, 339 [Google Scholar]
- Bogey, M., Demuynck, C., & Destombes, J. L. 1986, Chem. Phys. Lett., 125, 383 [NASA ADS] [CrossRef] [Google Scholar]
- Caselli, P., Keto, E., Bergin, E., et al. 2012, ApJ, 759, L37 [NASA ADS] [CrossRef] [Google Scholar]
- Ceccarelli, C., Caselli, P., Bockelée-Morvan, D., et al. 2014, in Protostars and Planets VI, eds. H. Beuther, R. S. Klessen, C. P. Dullemond, & T. Henning, 859 [Google Scholar]
- Chantzos, J., Spezzano, S., Caselli, P., et al. 2018, ApJ, 863, 126 [CrossRef] [Google Scholar]
- Cox, P., Guesten, R., & Henkel, C. 1988, A&A, 206, 108 [NASA ADS] [Google Scholar]
- Dislaire, V., Hily-Blant, P., Faure, A., et al. 2012, A&A, 537, A20 [NASA ADS] [CrossRef] [EDP Sciences] [Google Scholar]
- Drozdovskaya, M. N., Coudert, L. H., Margulès, L., et al. 2022, A&A, 659, A69 [NASA ADS] [CrossRef] [EDP Sciences] [Google Scholar]
- Enoch, M. L., Young, K. E., Glenn, J., et al. 2006, ApJ, 638, 293 [Google Scholar]
- Evans, N. J. II, Dunham, M. M., Jørgensen, J. K., et al. 2009, ApJS, 181, 321 [NASA ADS] [CrossRef] [Google Scholar]
- Ferrer Asensio, J., Spezzano, S., Caselli, P., et al. 2022, A&A, 667, A119 [NASA ADS] [CrossRef] [EDP Sciences] [Google Scholar]
- Fuchs, G. W., Cuppen, H. M., Ioppolo, S., et al. 2009, A&A, 505, 629 [NASA ADS] [CrossRef] [EDP Sciences] [Google Scholar]
- Furuya, K., Aikawa, Y., Hincelin, U., et al. 2015, A&A, 584, A124 [NASA ADS] [CrossRef] [EDP Sciences] [Google Scholar]
- Gerin, M., Wootten, H. A., Combes, F., et al. 1987, A&A, 173, L1 [NASA ADS] [Google Scholar]
- Giers, K., Spezzano, S., Alves, F., et al. 2022, A&A, 664, A119 [NASA ADS] [CrossRef] [EDP Sciences] [Google Scholar]
- Ginsburg, A., & Mirocha, J. 2011, PySpecKit: Python Spectroscopic Toolkit, Astrophysics Source Code Library [record ascl:1109.001] [Google Scholar]
- Ginsburg, A., Sokolov, V., de Val-Borro, M., et al. 2022, AJ, 163, 291 [NASA ADS] [CrossRef] [Google Scholar]
- Gratier, P., Majumdar, L., Ohishi, M., et al. 2016, ApJS, 225, 25 [Google Scholar]
- Gutermuth, R. A., Myers, P. C., Megeath, S. T., et al. 2008, ApJ, 674, 336 [NASA ADS] [CrossRef] [Google Scholar]
- Hatchell, J., Richer, J. S., Fuller, G. A., et al. 2005, A&A, 440, 151 [NASA ADS] [CrossRef] [EDP Sciences] [Google Scholar]
- Hidaka, H., Watanabe, M., Kouchi, A., & Watanabe, N. 2009, ApJ, 702, 291 [NASA ADS] [CrossRef] [Google Scholar]
- Higuchi, A. E., Sakai, N., Watanabe, Y., et al. 2018, ApJS, 236, 52 [Google Scholar]
- Jørgensen, J. K., Müller, H. S. P., Calcutt, H., et al. 2018, A&A, 620, A170 [Google Scholar]
- Keto, E., & Caselli, P. 2008, ApJ, 683, 238 [Google Scholar]
- Kirk, H., Johnstone, D., & Di Francesco, J. 2006, ApJ, 646, 1009 [Google Scholar]
- Kulterer, B. M., Fuente, A., Drozdovskaya, M. N., et al. 2026, ApJ, 997, 30 [Google Scholar]
- Lada, E. A., & Lada, C. J. 1995, AJ, 109, 1682 [NASA ADS] [CrossRef] [Google Scholar]
- Ladd, E. F., Lada, E. A., & Myers, P. C. 1993, ApJ, 410, 168 [NASA ADS] [CrossRef] [Google Scholar]
- Lin, Y., Spezzano, S., & Caselli, P. 2023, A&A, 669, L6 [NASA ADS] [CrossRef] [EDP Sciences] [Google Scholar]
- Linsky, J. L. 2003, Space Sci. Rev., 106, 49 [Google Scholar]
- Lis, D. C., Langer, W. D., Pineda, J. L., et al. 2025, A&A, 696, A61 [NASA ADS] [CrossRef] [EDP Sciences] [Google Scholar]
- Loison, J.-C., Agúndez, M., Wakelam, V., et al. 2017, MNRAS, 470, 4075 [Google Scholar]
- Lovas, F. J., Suenram, R. D., Ogata, T., & Yamamoto, S. 1992, ApJ, 399, 325 [CrossRef] [Google Scholar]
- Lucas, R., & Liszt, H. S. 2000, A&A, 358, 1069 [NASA ADS] [Google Scholar]
- Lupi, A., Bovino, S., & Grassi, T. 2021, A&A, 654, L6 [NASA ADS] [CrossRef] [EDP Sciences] [Google Scholar]
- Madden, S. C., Irvine, W. M., Matthews, H. E., Friberg, P., & Swade, D. A. 1989, AJ, 97, 1403 [NASA ADS] [CrossRef] [Google Scholar]
- Majumdar, L., Gratier, P., Andron, I., Wakelam, V., & Caux, E. 2017, MNRAS, 467, 3525 [NASA ADS] [CrossRef] [Google Scholar]
- Manigand, S., Jørgensen, J. K., Calcutt, H., et al. 2020, A&A, 635, A48 [NASA ADS] [CrossRef] [EDP Sciences] [Google Scholar]
- Martínez-Henares, A., Jiménez-Serra, I., Vastel, C., et al. 2025, A&A, 699, A382 [NASA ADS] [CrossRef] [EDP Sciences] [Google Scholar]
- Megías, A., Jiménez-Serra, I., Martín-Pintado, J., et al. 2023, MNRAS, 519, 1601 [Google Scholar]
- Melosso, M., Bizzocchi, L., Sipilä, O., et al. 2020, A&A, 641, A153 [NASA ADS] [CrossRef] [EDP Sciences] [Google Scholar]
- Morisawa, Y., Fushitani, M., Kato, Y., et al. 2006, ApJ, 642, 954 [Google Scholar]
- Muench, A. A., Lada, C. J., Luhman, K. L., Muzerolle, J., & Young, E. 2007, AJ, 134, 411 [Google Scholar]
- Osamura, Y., Roberts, H., & Herbst, E. 2004, A&A, 421, 1101 [NASA ADS] [CrossRef] [EDP Sciences] [Google Scholar]
- Pagani, L., Salez, M., & Wannier, P. G. 1992, A&A, 258, 479 [NASA ADS] [Google Scholar]
- Pagani, L., Vastel, C., Hugo, E., et al. 2009, A&A, 494, 623 [NASA ADS] [CrossRef] [EDP Sciences] [Google Scholar]
- Park, I. H., Herbst, E., Morisawa, Y., & Momose, T. 2005, in IAU Symposium, 231, Astrochemistry: Recent Successes and Current Challenges, eds. D. C. Lis, G. A. Blake, & E. Herbst, 32 [Google Scholar]
- Pety, J. 2005, in SF2A-2005: Semaine de l’Astrophysique Francaise, eds. F. Casoli, T. Contini, J. M. Hameury, & L. Pagani, 721 [Google Scholar]
- Pezzuto, S., Elia, D., Schisano, E., et al. 2012, A&A, 547, A54 [NASA ADS] [CrossRef] [EDP Sciences] [Google Scholar]
- Pezzuto, S., Benedettini, M., Di Francesco, J., et al. 2021, A&A, 645, A55 [EDP Sciences] [Google Scholar]
- Prodanović, T., Steigman, G., & Fields, B. D. 2010, MNRAS, 406, 1108 [NASA ADS] [Google Scholar]
- Richard, C., Jørgensen, J. K., Margulès, L., et al. 2021, A&A, 651, A120 [NASA ADS] [CrossRef] [EDP Sciences] [Google Scholar]
- Rodríguez-Baras, M., Fuente, A., Riviére-Marichalar, P., et al. 2021, A&A, 648, A120 [NASA ADS] [CrossRef] [EDP Sciences] [Google Scholar]
- Rodríguez-Baras, M., Esplugues, G., Fuente, A., et al. 2023, A&A, 679, A120 [NASA ADS] [CrossRef] [EDP Sciences] [Google Scholar]
- Sadavoy, S. I., di Francesco, J., André, P., et al. 2012, A&A, 540, A10 [NASA ADS] [CrossRef] [EDP Sciences] [Google Scholar]
- Sadavoy, S. I., Di Francesco, J., André, P., et al. 2014, ApJ, 787, L18 [NASA ADS] [CrossRef] [Google Scholar]
- Scibelli, S., Shirley, Y., Megías, A., & Jiménez-Serra, I. 2024, MNRAS, 533, 4104 [Google Scholar]
- Scibelli, S., Drozdovskaya, M. N., Caselli, P., et al. 2025, A&A, 702, A127 [NASA ADS] [CrossRef] [EDP Sciences] [Google Scholar]
- Spezzano, S., Tamassia, F., Thorwirth, S., et al. 2012, ApJS, 200, 1 [Google Scholar]
- Spezzano, S., Brünken, S., Schilke, P., et al. 2013, ApJ, 769, L19 [Google Scholar]
- Spezzano, S., Sipilä, O., Caselli, P., et al. 2022, A&A, 661, A111 [NASA ADS] [CrossRef] [EDP Sciences] [Google Scholar]
- Takakuwa, S., Kawaguchi, K., Mikami, H., & Saito, M. 2001, PASJ, 53, 251 [NASA ADS] [CrossRef] [Google Scholar]
- Tercero, F., López-Pérez, J. A., Gallego, J. D., et al. 2021, A&A, 645, A37 [EDP Sciences] [Google Scholar]
- Thaddeus, P., Vrtilek, J. M., & Gottlieb, C. A. 1985, ApJ, 299, L63 [NASA ADS] [CrossRef] [Google Scholar]
- van der Tak, F. F. S., Black, J. H., Schöier, F. L., Jansen, D. J., & van Dishoeck, E. F. 2007, A&A, 468, 627 [NASA ADS] [CrossRef] [EDP Sciences] [Google Scholar]
- van Gelder, M. L., Jaspers, J., Nazari, P., et al. 2022, A&A, 667, A136 [NASA ADS] [CrossRef] [EDP Sciences] [Google Scholar]
- Vrtilek, J. M., Gottlieb, C. A., & Thaddeus, P. 1987, ApJ, 314, 716 [CrossRef] [Google Scholar]
- Watanabe, N., & Kouchi, A. 2002, ApJ, 571, L173 [Google Scholar]
- Watanabe, N., Hidaka, H., Nagaoka, A., & Kouchi, A. 2005, in IAU Symposium, 231, Astrochemistry: Recent Successes and Current Challenges, eds. D. C. Lis, G. A. Blake, & E. Herbst, 182 [Google Scholar]
- Yang, Y.-L., Sakai, N., Zhang, Y., et al. 2021, ApJ, 910, 20 [Google Scholar]
- Zari, E., Lombardi, M., Alves, J., Lada, C. J., & Bouy, H. 2016, A&A, 587, A106 [NASA ADS] [CrossRef] [EDP Sciences] [Google Scholar]
- Zucker, C., Schlafly, E. F., Speagle, J. S., et al. 2018, ApJ, 869, 83 [NASA ADS] [CrossRef] [Google Scholar]
The Taurus starless and prestellar core volume densities are calculated in the same way as for the Perseus sources.
Appendix A Observed transitions
The observed c-C3H2, c-C3HD and c-C3D2 transitions are presented in Tables A.1, A.2 and A.3, respectively. The peak temperature (TMB), position (VLSR), width (FWHM), RMS, and S/N, calculated with the peak intensity, of the lines are given. The transitions that could not be fitted with pyspeckit are marked with an asterisk (*). For these transitions we provide the peak temperature, derived from the integrated area and an assumed FWHM value which is also indicated.
Observed c-C3H2 transitions.
Observed c-C3H2 transitions.
Observed c-C3D2 transitions.
Appendix B Column density calculation
With the aim of testing the viability of using fixed values for  and Tkin to compute the column density of c-C3H2 and its isotopologues with RADEX, we computed the column density for two transitions for a grid of
  and Tkin values. An example core was selected, Per317, and the column density for the ortho-c-C3H2 32,1 - 31,2 and para-c-C3H2 21,1 - 20,2 transitions were calculated for a
  range of 0.25 - 1.75×105 cm−3 and for a Tkin range of 10 - 21 K (Figures B.1 and B.2, respectively). The obtained column density values within the 10% observational uncertainty of the constrained
  and Tkin values taken from Scibelli et al. (2024), varies by less than a factor of 2. Thus, the approach of fixing the
  and Tkin values while taking into account a 10% observational uncertainty, is a reasonable assumption to derive the column densities of c-C3H2 and its isotopologues.
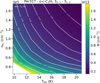 |
Fig. B.1 Column density of the ortho-c-C3H2 32,1 - 31,2 transition of Per317 plotted with a colour gradient for a range of |


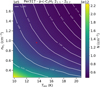 |
Fig. B.2 Column density of the para-c-C3H2 21,1 - 20,2 transition of Per317 plotted with a colour gradient for a range of |


B.1 Output  and Tkin
We report the constrained  and Tkin by RADEX for each of the molecules: orhto-c-C3H2, para-c-C3H2, c-C3HD and ortho-c-C3D2 (Tables B.1, B.2, B.3 and B.4, respectively). As seen above, the column density does not change significantly within the 10% error assumed for
  and Tkin. That is why the standard deviation of the volume density and kinetic temperature range within this 10% uncertainty, and thus why the values are not tightly constrained.
Constrained  and Tkin from the RADEX fitting of ortho-c-C3H2.
Constrained  and Tkin from the RADEX fitting of para-c-C3H2.
Constrained  and Tkin from the RADEX fitting of c-C3HD.
Constrained  and Tkin from the RADEX fitting of ortho-c-C3D2.
Appendix C Fractional abundance
The fractional abundance of c-C3H2, c-C3HD and c-C3D2 with respect to molecular hydrogen are plotted for the studied starless and prestellar cores in the Perseus molecular cloud (Figure C.1).
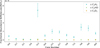 |
Fig. C.1 Abundance of c-C3H2, c-C3HD and c-C3D2 with respect to molecular hydrogen in blue, green and orange, respectively. |
All Tables
Starless and prestellar cores in the Perseus molecular cloud targeted in this study.
All Figures
|
Fig. 1 Molecular hydrogen column density ( |
| In the text | |
|
Fig. 2 Observed spectra of the c-C3H2 transitions organised by core number. All of the transitions for the same core are plotted in the same subplot with vertical offsets for clarity. The Gaussian fit from pyspeckit are overplotted with a blue line. The spectra without a Gaussian fit indicate a non-detection. Core number labels with a colour background indicate c-C3H2 has been detected towards the source. Lastly, horizontal dashed grey lines indicate 3σ levels. |
| In the text | |
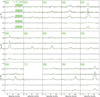 |
Fig. 3 Same as Figure 2, but for c-C3HD. Here the Gaussian fits and labels are plotted in green. |
| In the text | |
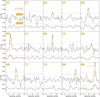 |
Fig. 4 Same as Figure 2, but for c-C3D2. Here the Gaussian fits and labels are plotted in orange. |
| In the text | |
|
Fig. 5 Observed spectra and the Gaussian fit from pyspeckit of c-C3HD, in green, and c-C3D2, in orange. Horizontal dashed grey lines indicate 3σ levels. |
| In the text | |
|
Fig. 6 Detection statistics of c-C3H2, in blue, c-C3HD, in green, and c-C3D2, in orange. The pie chart shows three categories: detected, not detected (ND), and not targeted (NT). c-C3H2 and c-C3HD were not targeted towards one of the cores, while C3D2 was targeted towards all of them. |
| In the text | |
|
Fig. 7 c-C3H2 otp ratios and their uncertainties are plotted for each core in blue. The median otp value as well as its standard deviation for each of the cores (3.5 ± 0.4) are plotted with a horizontal dashed grey line and grey band, respectively. The statistical value of 3 is marked by a horizontal solid blue line. |
| In the text | |
|
Fig. 8 Ortho-to-para ratios plotted against the kinetic temperature (left panel) and volume density (right panel) of the cores. The cores belonging to different regions within the Perseus molecular cloud are plotted with different colours (NGC1333 in teal, B1 in purple, IC348 in red, and B5 in yellow). The x-axis in the right panel is plotted in logarithmic scale for clarity. The dashed grey line indicates the linear correlation trend between the two variables. In the top left corner, the Pearson correlation coefficient is displayed. |
| In the text | |
|
Fig. 9 D/H ratios plotted versus the kinetic temperature (left panel) and volume density (right panel) of the cores. The cores belonging to different regions within the Perseus molecular cloud are plotted with different colours. The x-axis in the volume density plot is plotted in logarithmic scale for clarity. The dashed grey line indicates the linear correlation trend between the two variables. The Pearson correlation coefficient is displayed on the top left. |
| In the text | |
|
Fig. 10 D2/D ratios plotted versus the kinetic temperature (left panel) and volume density (right panel) of the cores. The cores belonging to different regions within the Perseus molecular cloud are plotted with different colours. The x-axis in the volume density plot is plotted on a logarithmic scale for clarity. The dashed grey line indicates the linear correlation trend between the two variables. The Pearson correlation coefficient is displayed on the top left. |
| In the text | |
|
Fig. 11 D2/D ratios plotted versus the D/H ratios. The cores belonging to different regions within the Perseus molecular cloud are plotted with different colours. The dashed grey line indicates the correlation trend between the two variables. In the top left corner, the correlation coefficient is displayed. |
| In the text | |
|
Fig. 12 Kinetic temperatures of clouds plotted against their volume densities. The x-axis is plotted on a logarithmic scale for clarity. The cores belonging to different regions within the Perseus molecular cloud are plotted with different colours. The dashed grey line indicates the correlation trend between the two variables. In the top right corner, the correlation coefficient is displayed. |
| In the text | |
|
Fig. 13 Statistically corrected D/H and D2/D ratios percentages for c-C3H2, in purple and orange, respectively, for the sources in the Perseus molecular cloud (this study, circles), and additional sources in the Chamaeleon molecular cloud, Cha-C2 (Lis et al. (2025), cross), and the Taurus molecular cloud, shaded in grey: CB23, L1400A, L1495, L1495AN, L1495AS, L1495B, L1512, L1517B, TMC2 (Chantzos et al. (2018), triangles), TMC-1C (Spezzano et al. (2013), square), and L1544 (Giers et al. (2022), diamond). The horizontal dashed purple and orange lines and bands indicate the median with standard deviation for the D/H and D2/D for the Perseus and the Taurus cores separately. For the Chamaeleon molecular cloud, just one source, Cha-C2, is reported, so no median is given. Instead the value of the corrected D/H ratio is plotted. |
| In the text | |
|
Fig. B.1 Column density of the ortho-c-C3H2 32,1 - 31,2 transition of Per317 plotted with a colour gradient for a range of |
| In the text | |
|
Fig. B.2 Column density of the para-c-C3H2 21,1 - 20,2 transition of Per317 plotted with a colour gradient for a range of |
| In the text | |
|
Fig. C.1 Abundance of c-C3H2, c-C3HD and c-C3D2 with respect to molecular hydrogen in blue, green and orange, respectively. |
| In the text | |
Current usage metrics show cumulative count of Article Views (full-text article views including HTML views, PDF and ePub downloads, according to the available data) and Abstracts Views on Vision4Press platform.
Data correspond to usage on the plateform after 2015. The current usage metrics is available 48-96 hours after online publication and is updated daily on week days.
Initial download of the metrics may take a while.