Open Access
Fig. 11
Download original image
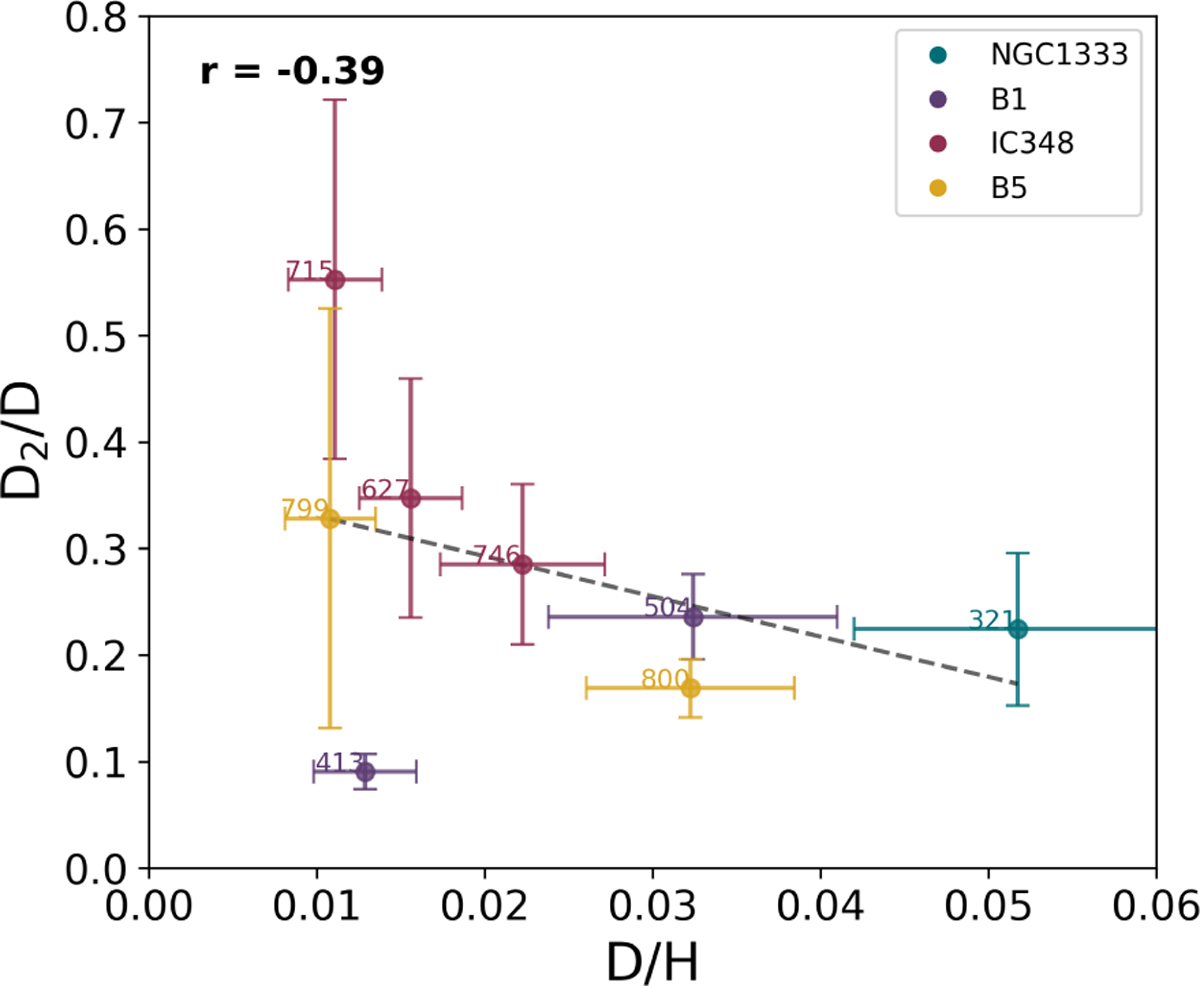
D2/D ratios plotted versus the D/H ratios. The cores belonging to different regions within the Perseus molecular cloud are plotted with different colours. The dashed grey line indicates the correlation trend between the two variables. In the top left corner, the correlation coefficient is displayed.
Current usage metrics show cumulative count of Article Views (full-text article views including HTML views, PDF and ePub downloads, according to the available data) and Abstracts Views on Vision4Press platform.
Data correspond to usage on the plateform after 2015. The current usage metrics is available 48-96 hours after online publication and is updated daily on week days.
Initial download of the metrics may take a while.