Fig. 13
Download original image
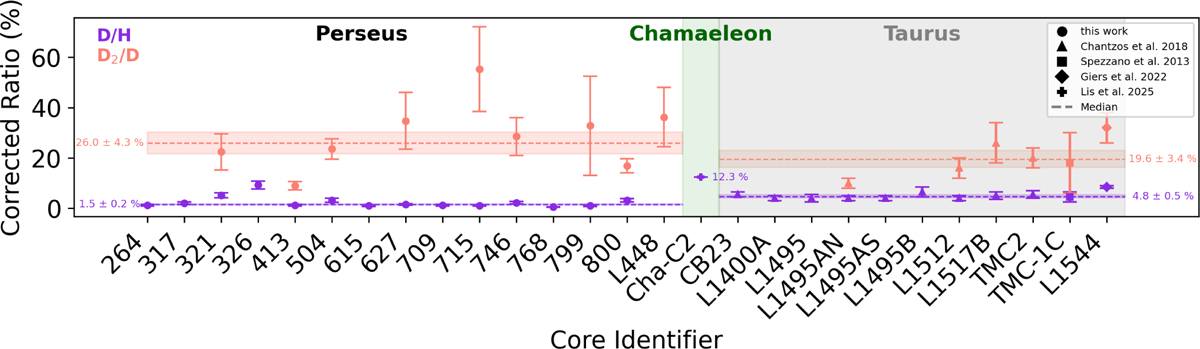
Statistically corrected D/H and D2/D ratios percentages for c-C3H2, in purple and orange, respectively, for the sources in the Perseus molecular cloud (this study, circles), and additional sources in the Chamaeleon molecular cloud, Cha-C2 (Lis et al. (2025), cross), and the Taurus molecular cloud, shaded in grey: CB23, L1400A, L1495, L1495AN, L1495AS, L1495B, L1512, L1517B, TMC2 (Chantzos et al. (2018), triangles), TMC-1C (Spezzano et al. (2013), square), and L1544 (Giers et al. (2022), diamond). The horizontal dashed purple and orange lines and bands indicate the median with standard deviation for the D/H and D2/D for the Perseus and the Taurus cores separately. For the Chamaeleon molecular cloud, just one source, Cha-C2, is reported, so no median is given. Instead the value of the corrected D/H ratio is plotted.
Current usage metrics show cumulative count of Article Views (full-text article views including HTML views, PDF and ePub downloads, according to the available data) and Abstracts Views on Vision4Press platform.
Data correspond to usage on the plateform after 2015. The current usage metrics is available 48-96 hours after online publication and is updated daily on week days.
Initial download of the metrics may take a while.