Open Access
Fig. B.2
Download original image
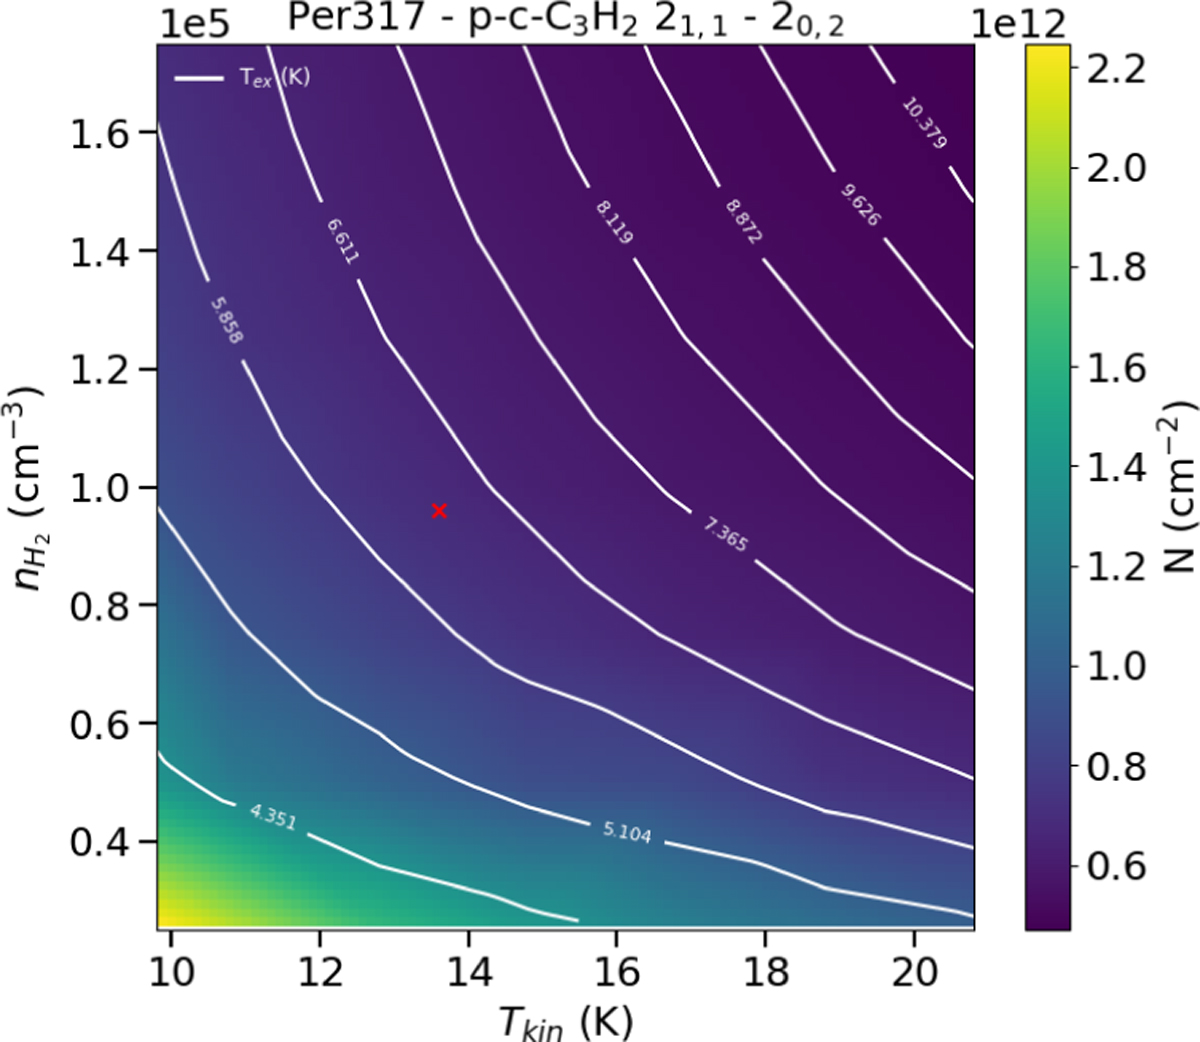
Column density of the para-c-C3H2 21,1 - 20,2 transition of Per317 plotted with a colour gradient for a range of ![]() and Tkin. The contour white lines indicate the excitation temperature of the transition, Tex, and the red cross marks the
and Tkin. The contour white lines indicate the excitation temperature of the transition, Tex, and the red cross marks the ![]() and Tkin values derived in Pezzuto et al. (2021).
and Tkin values derived in Pezzuto et al. (2021).
Current usage metrics show cumulative count of Article Views (full-text article views including HTML views, PDF and ePub downloads, according to the available data) and Abstracts Views on Vision4Press platform.
Data correspond to usage on the plateform after 2015. The current usage metrics is available 48-96 hours after online publication and is updated daily on week days.
Initial download of the metrics may take a while.