Fig. 2
Download original image
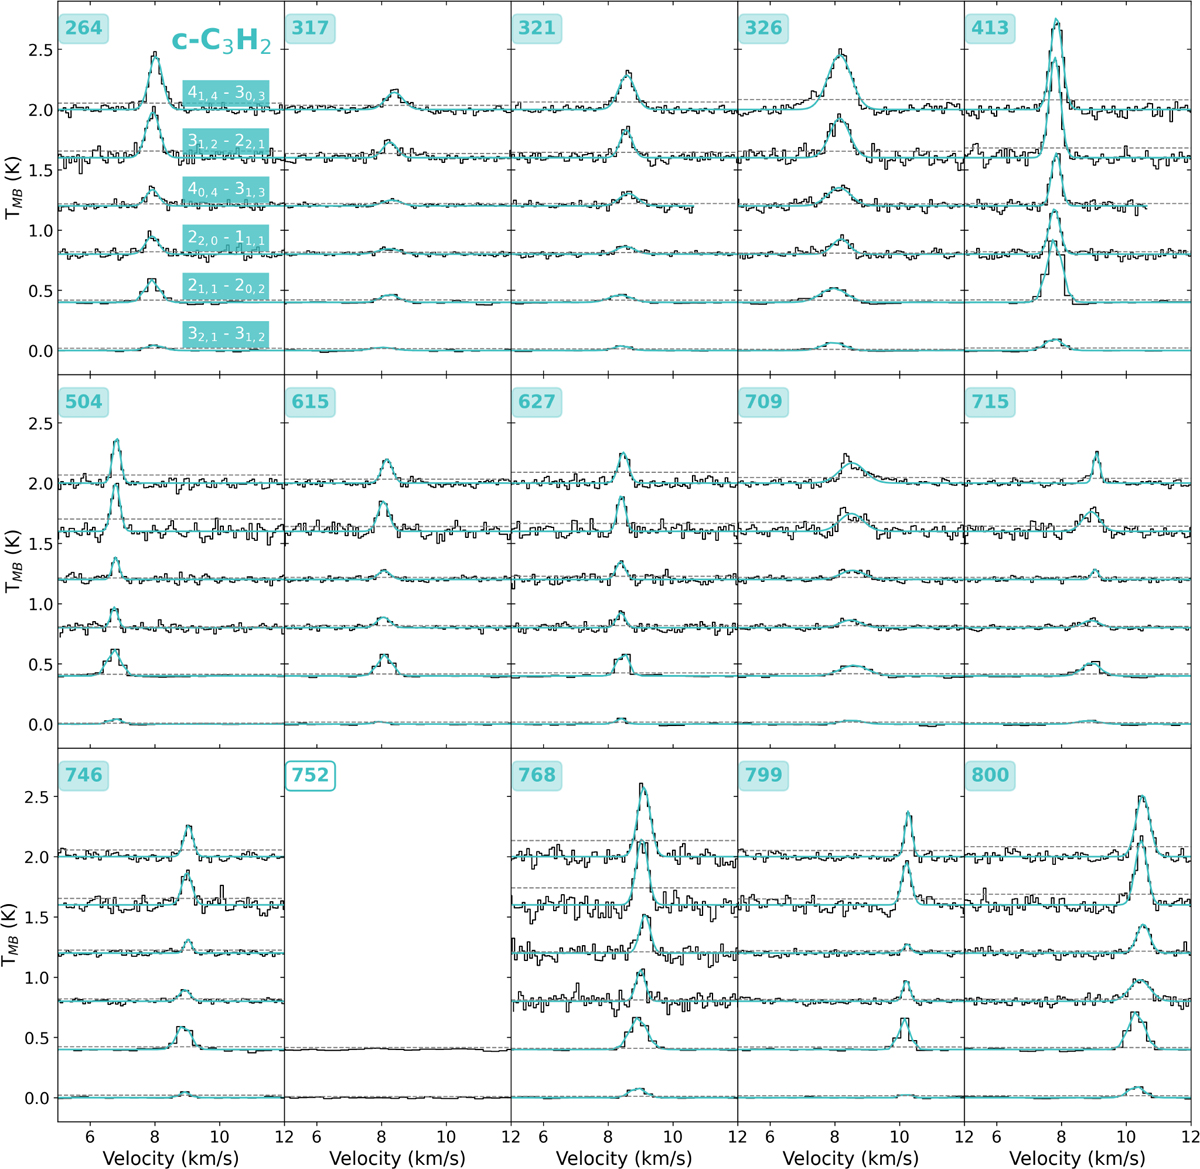
Observed spectra of the c-C3H2 transitions organised by core number. All of the transitions for the same core are plotted in the same subplot with vertical offsets for clarity. The Gaussian fit from pyspeckit are overplotted with a blue line. The spectra without a Gaussian fit indicate a non-detection. Core number labels with a colour background indicate c-C3H2 has been detected towards the source. Lastly, horizontal dashed grey lines indicate 3σ levels.
Current usage metrics show cumulative count of Article Views (full-text article views including HTML views, PDF and ePub downloads, according to the available data) and Abstracts Views on Vision4Press platform.
Data correspond to usage on the plateform after 2015. The current usage metrics is available 48-96 hours after online publication and is updated daily on week days.
Initial download of the metrics may take a while.