Open Access
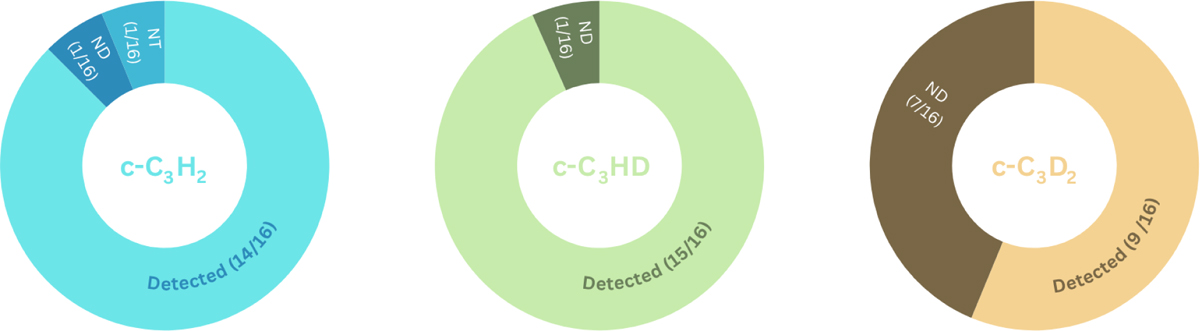
Fig. 6
Download original image
Detection statistics of c-C3H2, in blue, c-C3HD, in green, and c-C3D2, in orange. The pie chart shows three categories: detected, not detected (ND), and not targeted (NT). c-C3H2 and c-C3HD were not targeted towards one of the cores, while C3D2 was targeted towards all of them.
Current usage metrics show cumulative count of Article Views (full-text article views including HTML views, PDF and ePub downloads, according to the available data) and Abstracts Views on Vision4Press platform.
Data correspond to usage on the plateform after 2015. The current usage metrics is available 48-96 hours after online publication and is updated daily on week days.
Initial download of the metrics may take a while.