Fig. 2
Download original image
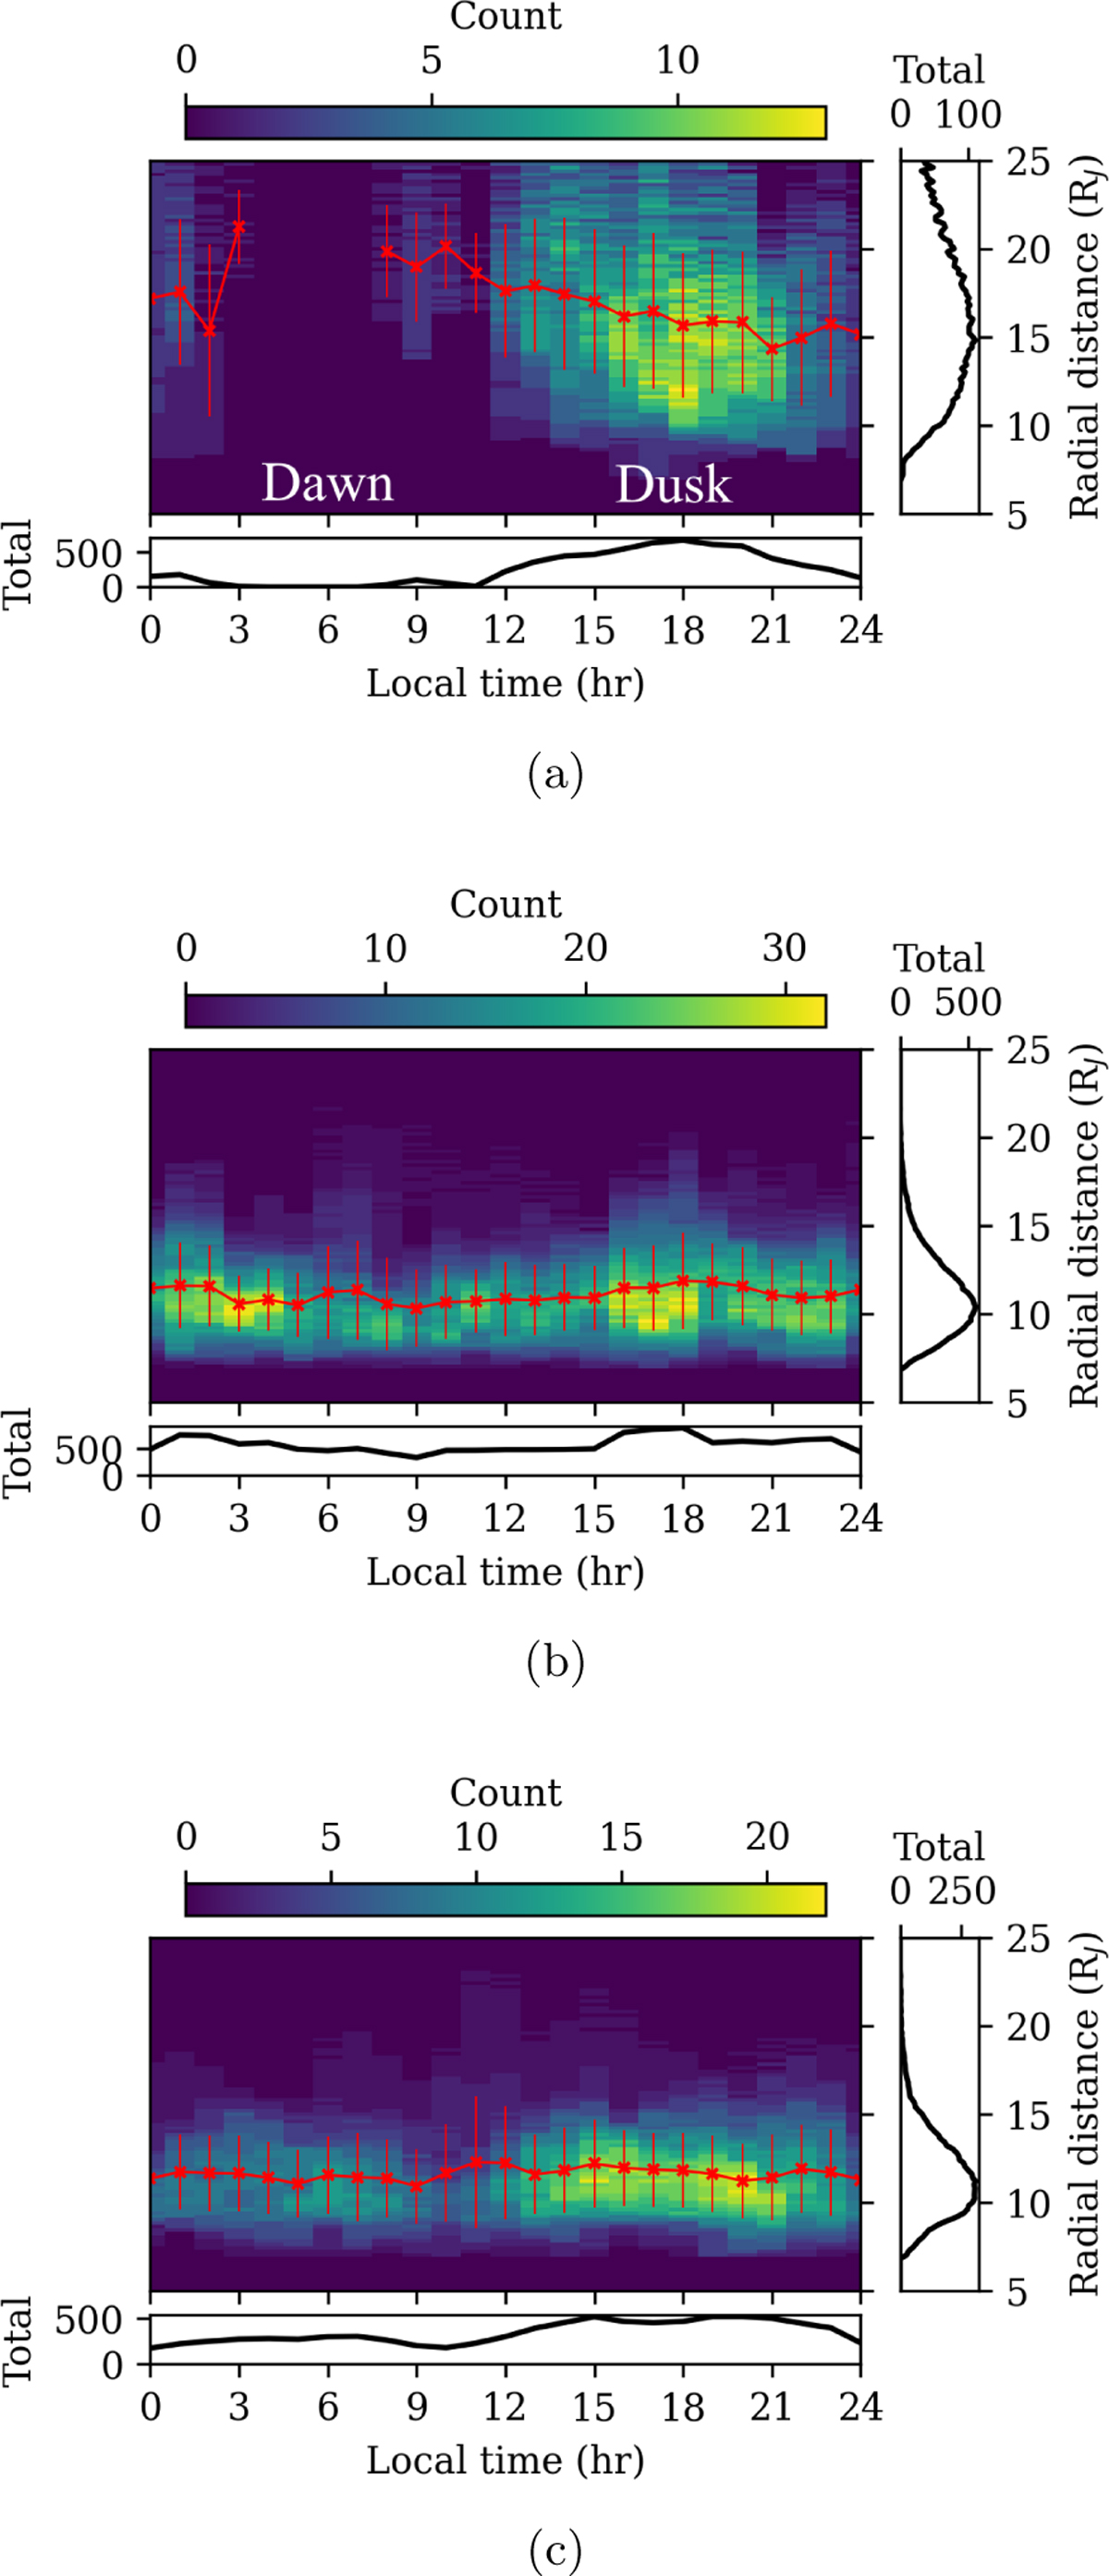
Histogram in radial distance and local time of the projected extent in the equatorial plasma sheet of (a) large blobs, (b) small blobs, and (c) arcs in the outer emission. The mean-average location for each local-time bin is given by the red line; error bars denote the standard deviation. Histograms flattened in local time and radial distance are given to the bottom and right of the main plot, respectively.
Current usage metrics show cumulative count of Article Views (full-text article views including HTML views, PDF and ePub downloads, according to the available data) and Abstracts Views on Vision4Press platform.
Data correspond to usage on the plateform after 2015. The current usage metrics is available 48-96 hours after online publication and is updated daily on week days.
Initial download of the metrics may take a while.