Open Access
Fig. 3
Download original image
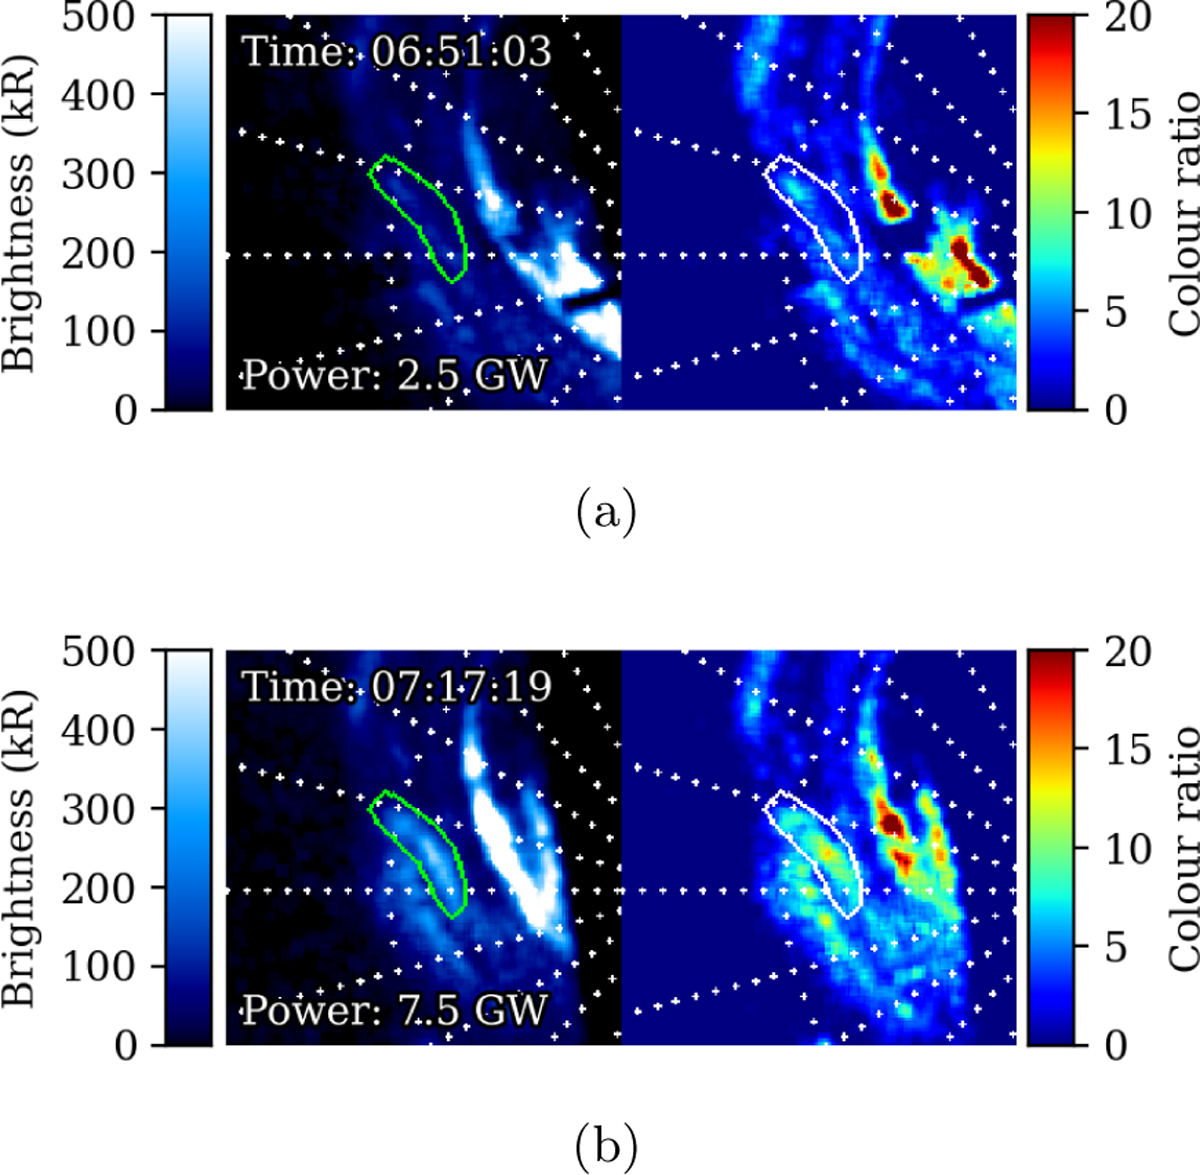
Injection signature observed on May 19, 2017, at (a) 06:51:03 and (b) 07:17:19 by Juno-UVS during PJ6-S, highlighted in green. The brightness map is given on the left and the colour-ratio map on the right. The main emission is present to the right of the injection signature.
Current usage metrics show cumulative count of Article Views (full-text article views including HTML views, PDF and ePub downloads, according to the available data) and Abstracts Views on Vision4Press platform.
Data correspond to usage on the plateform after 2015. The current usage metrics is available 48-96 hours after online publication and is updated daily on week days.
Initial download of the metrics may take a while.