Fig. 8
Download original image
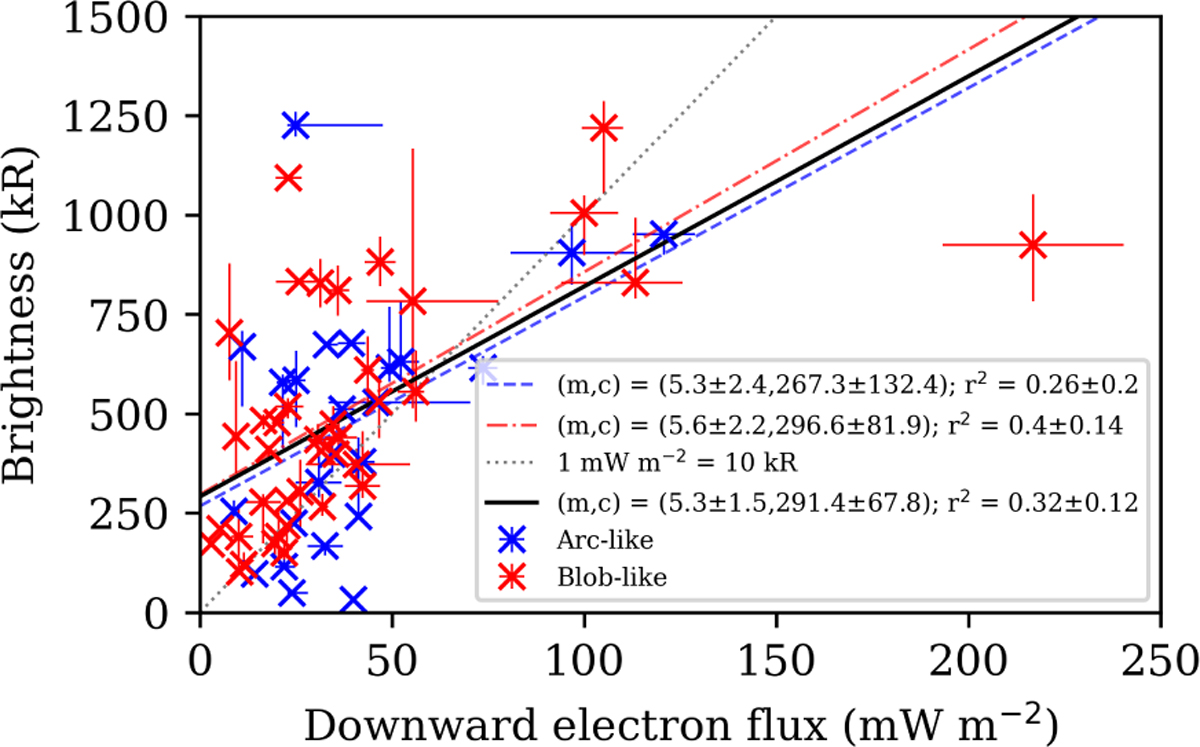
90th-percentile brightness vs 90th-percentile precipitating energy flux based on downward JEDI electrons (25-1000 keV) observed by Juno during crossings of arc-like (blue) and blob-like (red) features in the outer emission. Error bars denote the 80th-100th percentile range. The best-fit linear relation is given by a solid black line, as well as separate best-fit relations for the arc-like (dashed) and blob-like (dash-dotted) features. The theoretical relation after Gérard et al. (2016) is given by the dotted grey line.
Current usage metrics show cumulative count of Article Views (full-text article views including HTML views, PDF and ePub downloads, according to the available data) and Abstracts Views on Vision4Press platform.
Data correspond to usage on the plateform after 2015. The current usage metrics is available 48-96 hours after online publication and is updated daily on week days.
Initial download of the metrics may take a while.