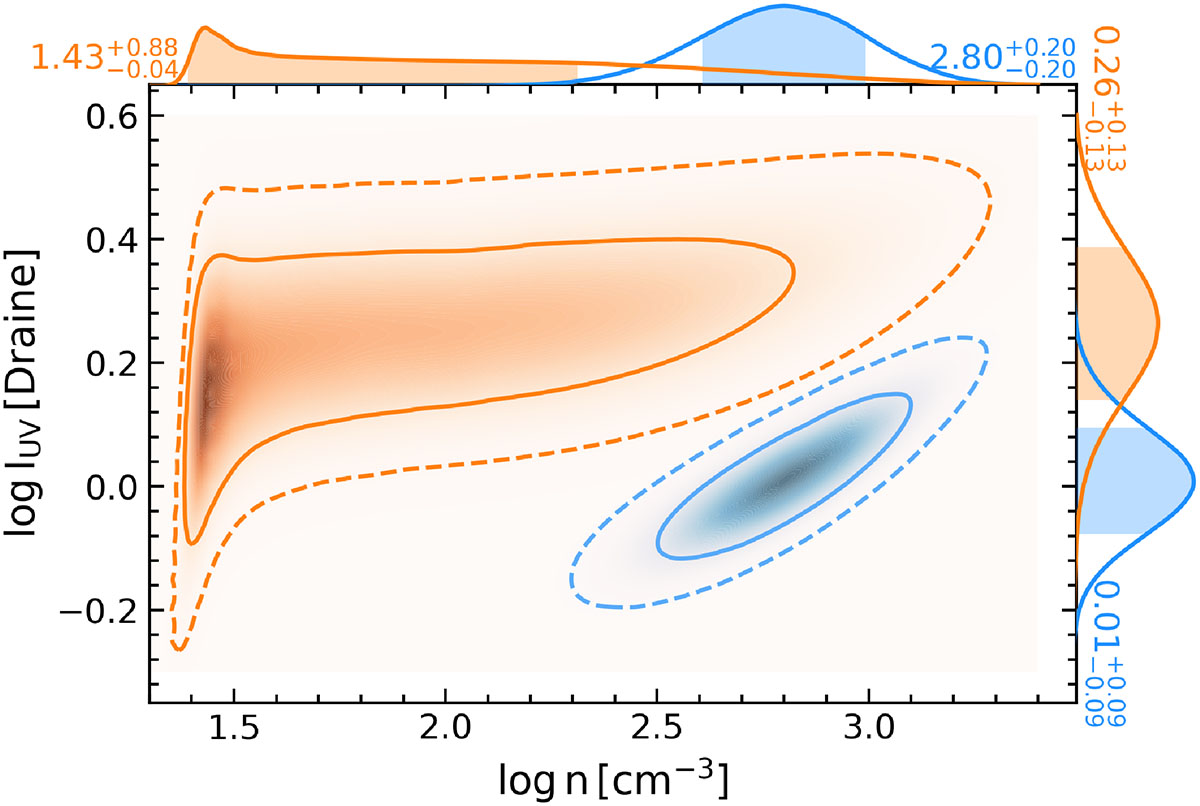
Fig. 4.
Download original image
Posterior distributions of the UV field and number density in the broad (orange) and narrow (blue) components. The likelihood was derived by comparing the observed H2J = 0 to J = 3 column densities with those from a grid of Cloudy models and converted into 2D posterior distribution assuming independent flat priors in logarithmic space. The 1D marginalised posteriors are shown along the top and right axes.
Current usage metrics show cumulative count of Article Views (full-text article views including HTML views, PDF and ePub downloads, according to the available data) and Abstracts Views on Vision4Press platform.
Data correspond to usage on the plateform after 2015. The current usage metrics is available 48-96 hours after online publication and is updated daily on week days.
Initial download of the metrics may take a while.