Open Access
Fig. 3.
Download original image
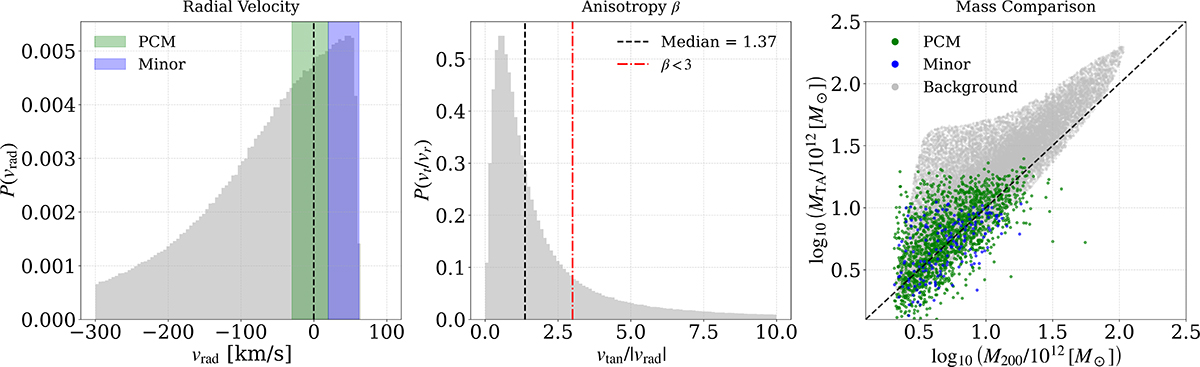
Kinematic properties of the simulated pair sample. The panels show the radial velocity cuts used to define the PCM (green) and minor (blue) candidates (left); the velocity anisotropy distribution (middle); and the resulting MTA vs. M200 relation for each group (right).
Current usage metrics show cumulative count of Article Views (full-text article views including HTML views, PDF and ePub downloads, according to the available data) and Abstracts Views on Vision4Press platform.
Data correspond to usage on the plateform after 2015. The current usage metrics is available 48-96 hours after online publication and is updated daily on week days.
Initial download of the metrics may take a while.