Open Access
Fig. D.1
Download original image
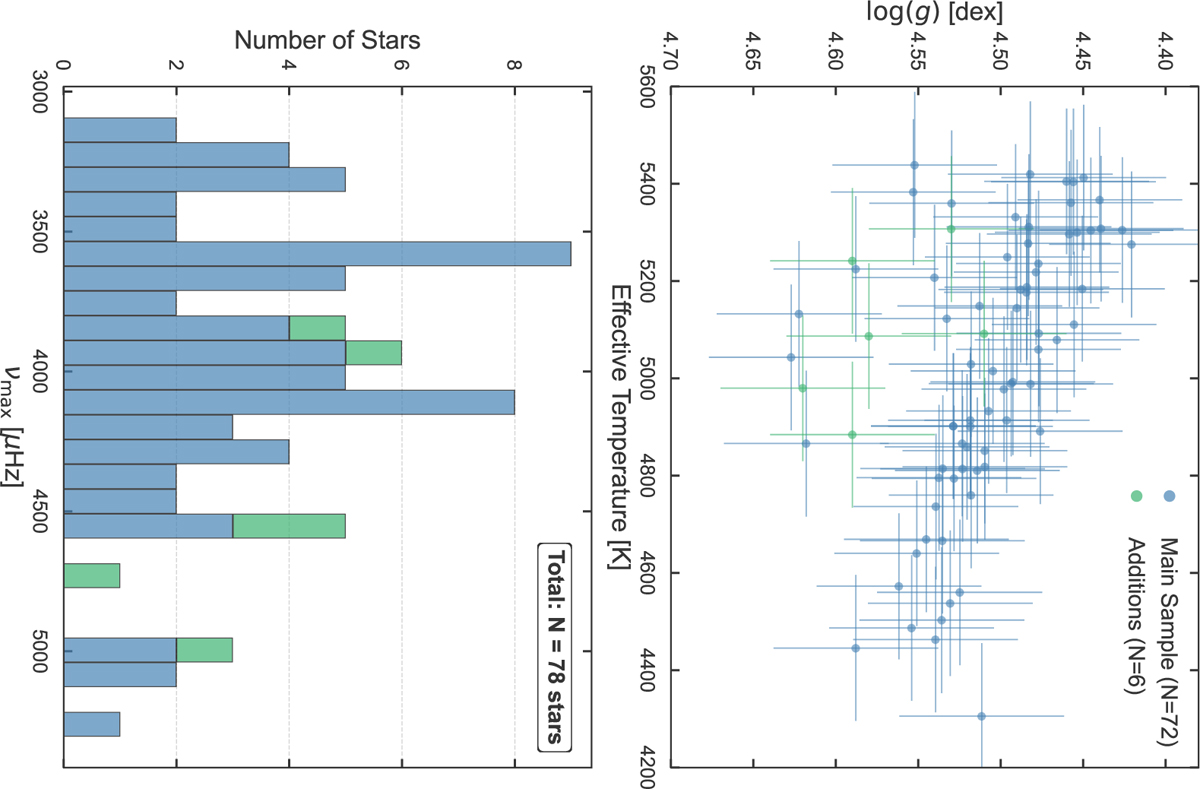
Kiel diagram and vmax distribution of the TESS K-dwarf sample. The initial list obtained through the Gaia query and TESS 20 second cadence overlap is shown in blue, while the manual additions are indicated in green.
Current usage metrics show cumulative count of Article Views (full-text article views including HTML views, PDF and ePub downloads, according to the available data) and Abstracts Views on Vision4Press platform.
Data correspond to usage on the plateform after 2015. The current usage metrics is available 48-96 hours after online publication and is updated daily on week days.
Initial download of the metrics may take a while.