Fig. E.1
Download original image
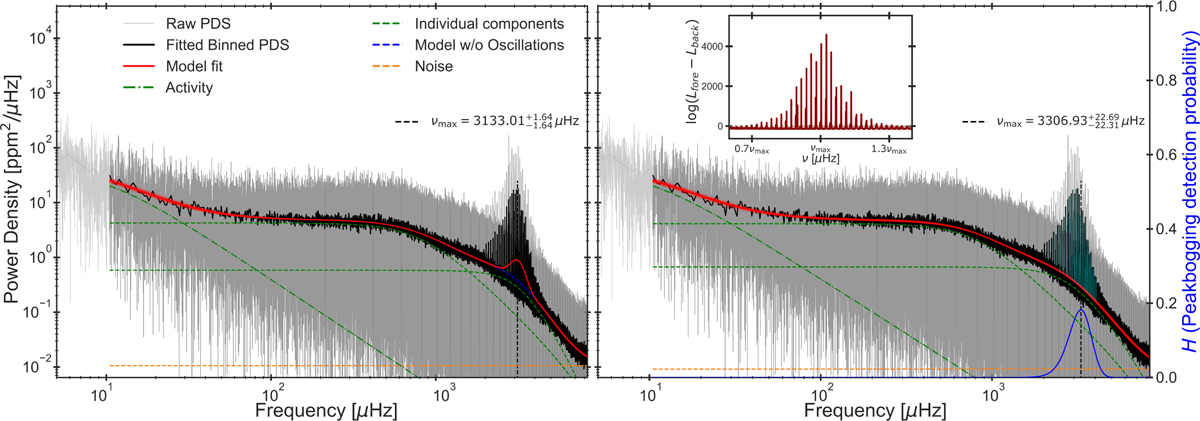
Background fits for the Sun using a Gaussian envelope (left) and peakbogging (right). A two-component Harvey model (H) is used for the inference on the PDS of a ∼3.15 year time series of VIRGO (Fröhlich et al. 1995) blue band data taken during the solar minimum between cycle 23 and 24. Left: the unbinned PDS shown in grey and the binned version is overplotted in black. The model is plotted in red using the median of the obtained posteriors for each fit parameter. Additionally, 50 randomly drawn samples from the posteriors are plotted to indicate the scatter. The individual granulation components are plotted as dashed green profiles. The fitted value of vmax is given and indicated by the vertical dashed black line, while the noise is shown by the horizontal dashed orange line. The activity component is the dash-dotted green line. The model without the influence of the Gaussian oscillation excess is plotted as the dashed blue profile, visible underneath the oscillation excess. Right: same as left, but the Gaussian mixture coefficient controlling the peakbog mixture-model likelihood in Eq. E.1 is plotted as the blue profile, with the secondary y-axis showing the amplitude, H. Whenever log (ℒforeground−ℒbackground)>2, the data is coloured cyan to indicate the dominance of the foreground contribution in the peakbogging. The insert shows the log-likelihood ratio between the foreground and background contributions of the mixture model in a region around vmax.
Current usage metrics show cumulative count of Article Views (full-text article views including HTML views, PDF and ePub downloads, according to the available data) and Abstracts Views on Vision4Press platform.
Data correspond to usage on the plateform after 2015. The current usage metrics is available 48-96 hours after online publication and is updated daily on week days.
Initial download of the metrics may take a while.