Fig. E.4
Download original image
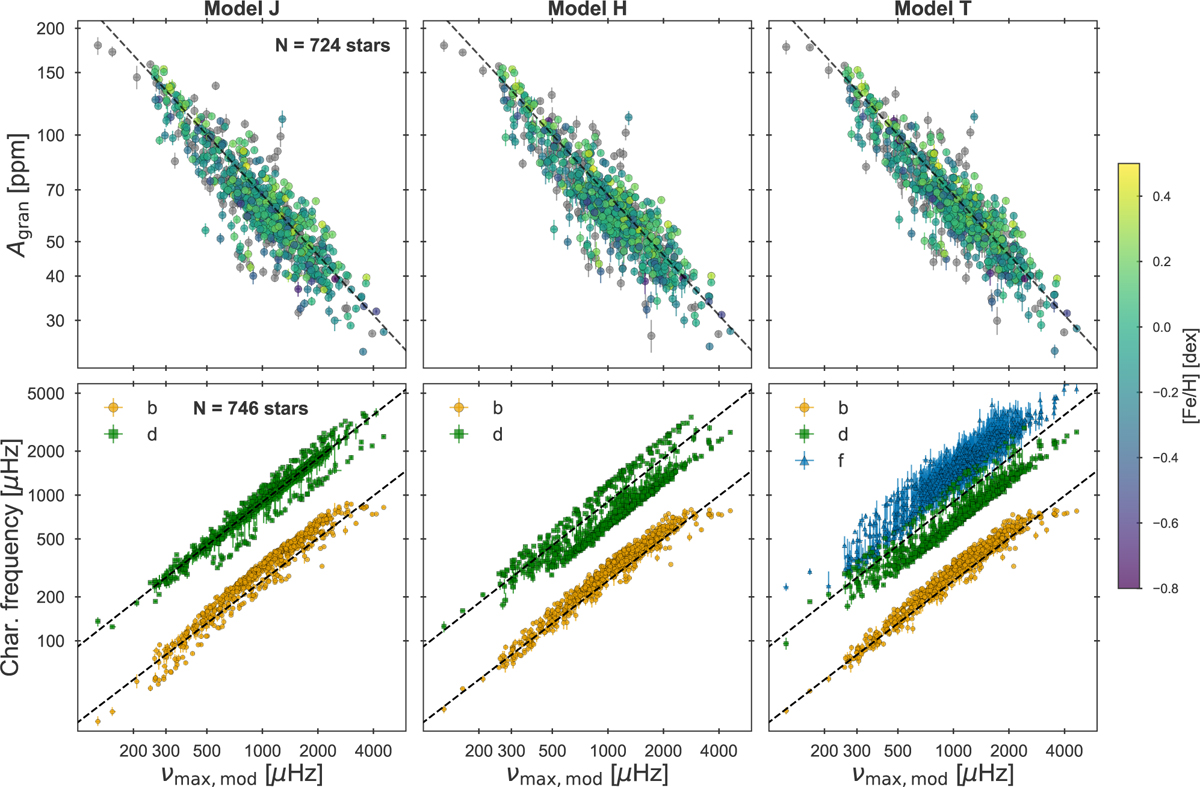
Total granulation amplitudes and characteristic frequencies as a function of vmax obtained by the three background models of Table 1. In all panels, the dashed lines represent the corresponding scaling relation for the parameter from Kallinger et al. (2014). Top row: total granulation amplitudes colour-coded by the stellar metallicity [Fe/H] for the 724 stars with available temperatures. Bottom row: the characteristic frequencies of the individual granulation components for the 746 stars with consistent posteriors, with colours as indicated by the legend.
Current usage metrics show cumulative count of Article Views (full-text article views including HTML views, PDF and ePub downloads, according to the available data) and Abstracts Views on Vision4Press platform.
Data correspond to usage on the plateform after 2015. The current usage metrics is available 48-96 hours after online publication and is updated daily on week days.
Initial download of the metrics may take a while.