Fig. 4
Download original image
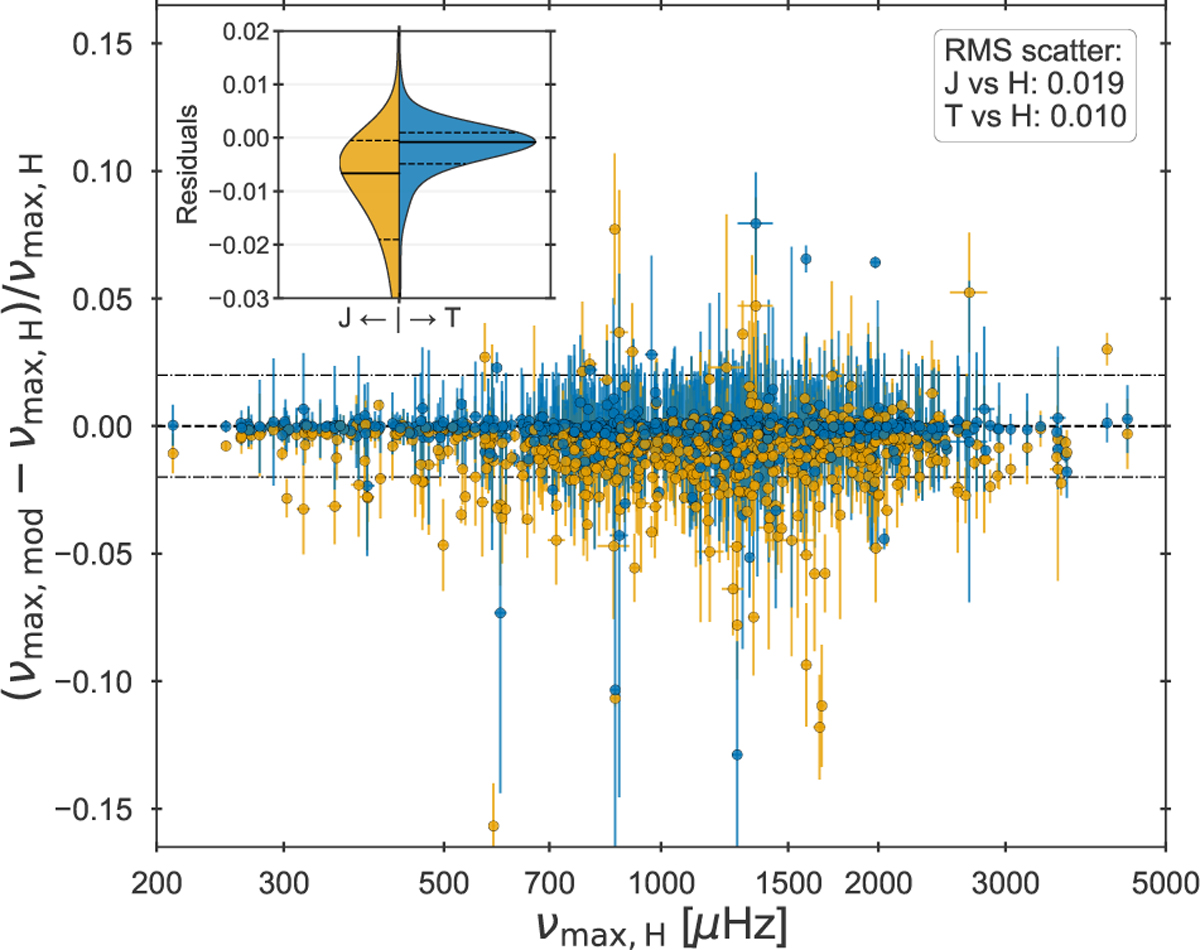
Comparison of the vmax determination across the different models. The vmax fractional residuals of models J and T to those obtained by model H are plotted in yellow and blue, respectively. The horizontal dashed line indicates perfect agreement in vmax determinations, while the dot-dashed show the 2% bounds. The RMS scatter was calculated for both cases and is provided in the inserted box in the top right. The insert shows a split violin plot of the vmax residual distributions for model J (left) and model T (right) versus model H, with medians and 16th/84th percentiles overplotted as full and dashed horizontal lines, respectively.
Current usage metrics show cumulative count of Article Views (full-text article views including HTML views, PDF and ePub downloads, according to the available data) and Abstracts Views on Vision4Press platform.
Data correspond to usage on the plateform after 2015. The current usage metrics is available 48-96 hours after online publication and is updated daily on week days.
Initial download of the metrics may take a while.