Fig. 7
Download original image
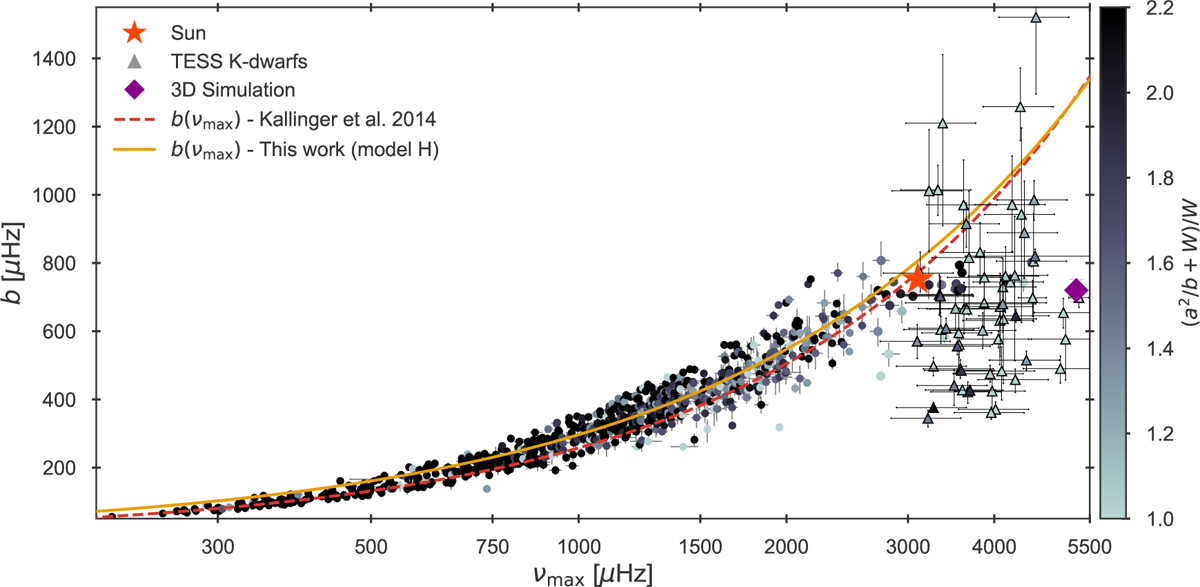
Timescale of the primary granulation component against the oscillation timescale vmax, indicating a decoupling through a plateau beyond vmax ≈ 3000 μHz. The plotted values are those estimated by the background model preferred by the Bayesian evidence 𝒵. The Kepler sample is replotted from Fig. 6. The TESS K-dwarf additions are shown as the triangular points with black outlines. The Sun is shown as the dark orange star symbol, obtained using a ∼3.15 year time series from VIRGO (Fröhlich et al. 1995) blue band data taken during the solar minimum between solar cycle 23 and 24. Lastly, a STAGGER (Stein et al. 2024) 3D hydrodynamical simulation replicating the K-dwarf ε Indi A is shown as the purple diamond. The colouring indicates an S/N-proxy as the ratio between the estimated granulation amplitude level and the white noise, where stars exhibiting higher degrees of contrast are darker.
Current usage metrics show cumulative count of Article Views (full-text article views including HTML views, PDF and ePub downloads, according to the available data) and Abstracts Views on Vision4Press platform.
Data correspond to usage on the plateform after 2015. The current usage metrics is available 48-96 hours after online publication and is updated daily on week days.
Initial download of the metrics may take a while.