Fig. 8
Download original image
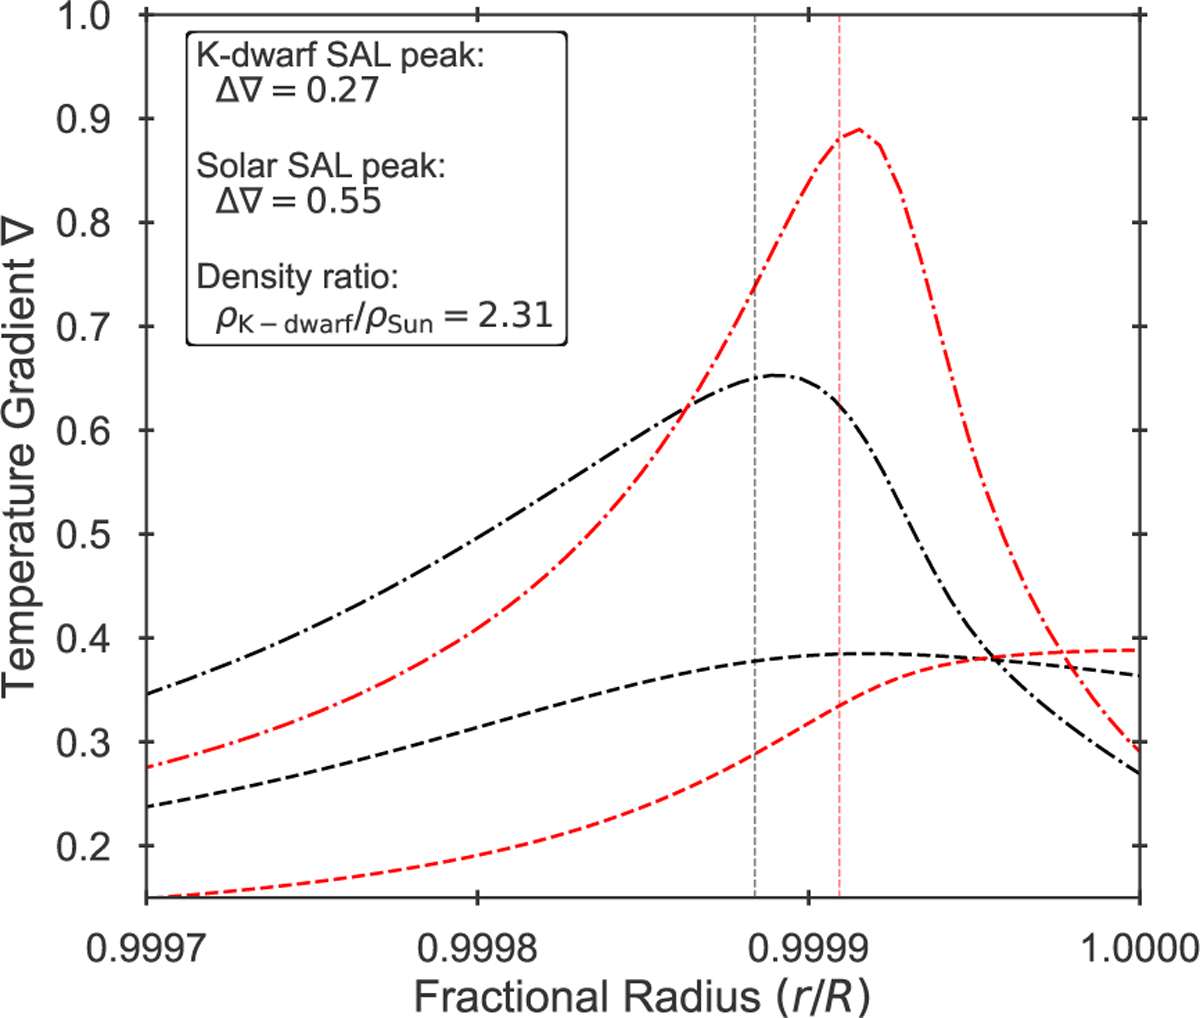
Temperature gradients in the super-adiabatic layer (SAL) of a K dwarf (black) and solar model (red). The dashed and dot-dashed lines show the adiabatic gradient ∇ad and the structural gradient ∇, respectively. The vertical dashed lines indicate the radial location of the maximum difference between the gradients, and the diagnostic inserts presents the values of this difference along with the ratio of the local density at this point between the models.
Current usage metrics show cumulative count of Article Views (full-text article views including HTML views, PDF and ePub downloads, according to the available data) and Abstracts Views on Vision4Press platform.
Data correspond to usage on the plateform after 2015. The current usage metrics is available 48-96 hours after online publication and is updated daily on week days.
Initial download of the metrics may take a while.