Fig. 9
Download original image
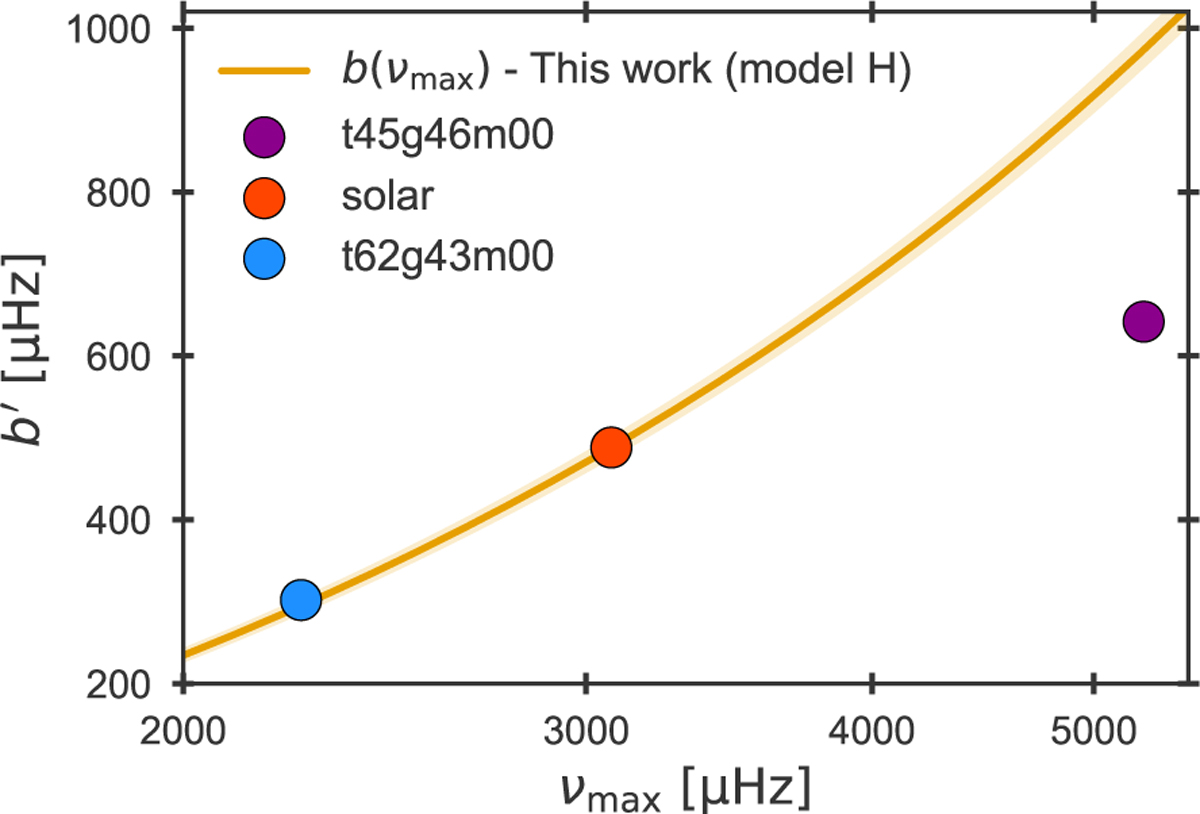
Inverse of the granulation timescale, b′, plotted against the oscillation timescale vmax, estimated from the three 3D simulations listed in Table 2. We note that vmax was calculated using the asteroseismic scaling relation based on the fundamental parameters of the simulations. The gold solid line shows the fitted power law for model H from Fig. 6 with uncertainties indicated by the shaded bands, but scaled to pass the solar simulation.
Current usage metrics show cumulative count of Article Views (full-text article views including HTML views, PDF and ePub downloads, according to the available data) and Abstracts Views on Vision4Press platform.
Data correspond to usage on the plateform after 2015. The current usage metrics is available 48-96 hours after online publication and is updated daily on week days.
Initial download of the metrics may take a while.