| Issue |
A&A
Volume 707, March 2026
|
|
|---|---|---|
| Article Number | L7 | |
| Number of page(s) | 4 | |
| Section | Letters to the Editor | |
| DOI | https://doi.org/10.1051/0004-6361/202558750 | |
| Published online | 26 February 2026 | |
Letter to the Editor
Lyman continuum escaping from in situ formed stars in a tidal bridge at z = 3
1
The Oskar Klein Centre, Department of Astronomy, Stockholm University, AlbaNova 10691 Stockholm, Sweden
2
Minnesota Institute for Astrophysics, University of Minnesota 116 Church Street SE Minneapolis MN 55455, USA
3
Institute for Astronomy, University of Edinburgh, Royal Observatory Edinburgh EH9 3HJ, UK
4
International Space Science Institute Hallerstrasse 6 3012 Bern, Switzerland
5
Department of Astronomy, University of Michigan 1085 S. University Ave Ann Arbor MI 48109, USA
6
IPAC, California Institute of Technology 1200 E. California Blvd. Pasadena CA 91125, USA
7
Department of Astronomy, University of California, Berkeley Berkeley CA 94720, USA
8
Department of Astronomy and Astrophysics, University of Chicago 5640 South Ellis Avenue Chicago IL 60637, USA
9
Kavli Institute for Cosmological Physics, University of Chicago Chicago IL 60637, USA
10
Institute of Theoretical Astrophysics, University of Oslo P.O. Box 1029 Blindern NO-0315 Oslo, Norway
11
Astrophysics Science Division, Code 660, NASA Goddard Space Flight Center 8800 Greenbelt Rd. Greenbelt MD 20771, USA
★ Corresponding author: This email address is being protected from spambots. You need JavaScript enabled to view it.
Received:
23
December
2025
Accepted:
5
February
2026
Abstract
We present an analysis of archival JWST NIRSpec IFS and HST imaging observations of the z = 3 Lyman continuum emitter (LCE) candidate LACES104037. We show that a nearby galaxy, denoted LACES104037-S, has a redshift offset from the main galaxy by only ∼ 450 km s−1. Together with the identification of a tidal bridge between the galaxies, this indicates that the galaxies are interacting and most likely in the early stages of a merger. We show that the rest-frame LCE cluster sits ∼ 2.7 kpc from the galaxy core in the tidal bridge. It is faint in the nonionizing stellar continuum and shows faint but nonnegligible Hα and [O III] emission, suggesting that much of the gas surrounding the LCE cluster has been dispersed by feedback in the shallower gravitational potential of the tidal bridge. Comparing the direct LyC escape and the local Hα emission, we find a total ionizing escape fraction of fescLyC =57 ± 8% from the LCE cluster. We estimate the age of the LCE cluster to ≲ 6.5 Myr, indicating that the cluster must have formed in situ in the tidal bridge well after the time of closest interaction. LyC escape from tidal stripping or in situ formed stars in tidal features would depend less on intrinsic galaxy properties than typically observed in low-z LCE surveys and could help explain the higher cosmic escape fraction and enhanced diversity of LCE galaxy properties observed at cosmic noon.
Key words: galaxies: interactions / galaxies: kinematics and dynamics / galaxies: starburst / dark ages, reionization, first stars
© The Authors 2026
 Open Access article, published by EDP Sciences, under the terms of the Creative Commons Attribution License (https://creativecommons.org/licenses/by/4.0), which permits unrestricted use, distribution, and reproduction in any medium, provided the original work is properly cited.
This article is published in open access under the Subscribe to Open model. This email address is being protected from spambots. You need JavaScript enabled to view it. to support open access publication.
1. Introduction
Young star-forming galaxies contributed a major part of the ionizing Lyman continuum (LyC) photons that re-ionized the intergalactic medium (IGM) in the epoch of reionization (EoR) (e.g., Faucher-Giguère 2020; Haardt & Madau 2012; Wise 2019). Estimates of the cosmic LyC escape fraction required to account for the EoR are centered around 10–20% (Robertson et al. 2015; Naidu et al. 2020; Giovinazzo et al. 2025); however, some estimates go higher (Davies et al. 2021), while some go as low as ∼ 5% (Finkelstein et al. 2019; Atek et al. 2024). At low redshifts, the average escape fraction is consistently far below these values. At z ≲ 0.1, it is negligible, with only two known LyC emitter (LCE) galaxies, each with fesc ≲ 5% (Puschnig et al. 2017; Komarova et al. 2024). In the low-redshift Universe, z ≲ 0.4, about 70 LCEs are known, some of which have very high escape fractions (e.g., Borthakur et al. 2014; Izotov et al. 2018, 2025; Flury et al. 2022a; Malkan & Malkan 2021). Such LCEs, however, are rare, and the cosmic escape fraction is very low. Stacking analyses at z ∼ 1 and z ∼ 3 have consistently shown upper limits to the average escape fraction that are well below what is required to account for the EoR (Cowie et al. 2009; Rutkowski et al. 2016; Grazian et al. 2017; Alavi et al. 2020).
Strong LyC escape depends on a high production rate of ionizing photons and on mechanisms carving out channels through the neutral interstellar medium (ISM) to enable the free passage of LyC photons into the IGM (e.g., Trebitsch et al. 2017; Kakiichi & Gronke 2021). In the low-redshift Universe, LyC escape correlates with observables such as the UV β slope, reflecting a low dust content and a young stellar population with a high LyC production rate (Ji et al. 2020; Kim et al. 2020; Flury et al. 2022b, 2025); with the [O III]/[O II] ratio, which reflects the ionization level of the ISM (Izotov et al. 2018; Flury et al. 2022a); with weak neutral absorption features, reflecting a low H I column density along the line of sight (Chisholm et al. 2018; Gazagnes et al. 2020; Saldana-Lopez et al. 2022); and with broad emission line components, reflecting strong bulk outflows that can rupture the H I envelope around the source star cluster (Alexandroff et al. 2015; Chisholm et al. 2017; Mainali et al. 2022; Amorín et al. 2024). However, many of these correlations, such as [O III]/[O II], βUV and Lyα equivalent width, are weakened or break down at z ≳ 2 (Zhu et al. 2025; Giovinazzo et al. 2025; Rivera-Thorsen et al. 2022; Saxena et al. 2022; Bassett et al. 2022; Kerutt et al. 2024; Mascia et al. 2025; Citro et al. 2025), leaving a more diverse population of leakers observed at higher redshifts. This shift to a more diverse leaker population suggests that LyC escape at z ≳ 2 depends less on the intrinsic properties of the leaking galaxies than at lower redshifts.
Mergers and major interactions have been suggested by multiple authors as triggers of LyC escape, as they can both induce strong star formation and displace gas from stars (e.g., Bridge et al. 2010; Bergvall et al. 2013; Le Reste et al. 2024). Indeed, the cosmic rate of mergers and major interactions has been found to rise by an order of magnitude from z ∼ 0.3 to z ∼ 3, after which it stays within a factor of a few, which is roughly consistent with the evolution in  (Puskás et al. 2025; Duan et al. 2025). In the z ∼ 0.3 Low-redshift Lyman Continuum Survey, follow-up imaging has shown that at least 40% of the sample galaxies show signs of undergoing mergers (Le Reste et al. 2026), a strong overrepresentation compared to the ∼ 5% of the general low-redshift population (e.g., Darg et al. 2010). Kostyuk & Ciardi (2025) find that simulated galaxies at 6 ≲ z ≲ 10 have an average fesc ∼ 15% if they were merging, compared to ∼ 3% if they were not. Observationally, Zhu et al. (2025) found from visual classification that 20 of 23 LCEs at z ∼ 3 in GOODS-South were undergoing mergers, and Yuan et al. (2024) find that a dominant fraction of z ≳ 3 LCEs show spatial offsets between LyC emission and nonionizing continuum. In contrast, Mascia et al. (2025) compared the merger rate of a number of EoR galaxies to statistical tracers of LyC escape and found no statistical correlation. However, these authors relied on LCE tracers calibrated in the local Universe. While they did adjust for the known cosmic evolution of these tracers, such an analysis is still vulnerable to any unknown biases built into these local calibrations, biases which are evident from the increased diversity of LCEs observed at z ≳ 3. Mergers can cause LyC escape through either induced bursty star formation or spatial displacement of neutral gas from the bulk of the galaxy’s stars. Merger-induced central starbursts are not qualitatively different from other starbursts and thus should not give rise to any deviation from the correlations between LCE and bursty star formation established at low redshifts. In contrast, tidal displacement of neutral ISM from the bulk of the stars and possible in situ star formation in outer regions of a galaxy leads to less dependence on intrinsic galaxy properties of LyC escape and can potentially give rise to the observed diversity of LCE galaxies observed at z ≳ 2. However, such scenarios have barely been studied observationally. One example of LyC escape facilitated by tidal stripping of H I during a major merger was observed directly in the nearby galaxy Haro 11 by Le Reste et al. (2024), Ejdetjärn et al. (2025), and Rivera-Thorsen et al. (2025) reported circumstantial evidence for a similar scenario in the gravitationally lensed z = 2.37 Sunburst Arc.
In this work, we present observational evidence for LyC escaping from young stars formed in situ in a tidal bridge extending from a starburst galaxy at z = 3 toward a spectroscopically confirmed interacting companion. This adds to the mounting evidence that such configurations might be more common than previously thought. Throughout this paper, we assume a standard flat Λ-CDM cosmology with H = 70 km s−1 Mpc−1 and ΩM = 0.3. Images are oriented as north up, east left.
2. Target and observations
LACES104037 was first reported as an LCE by Fletcher et al. (2019). These authors classified it as part of their “silver” sample because the offset between the observed rest-frame LyC and the core of nonionizing continuum was slightly more than 0.6″, which they associated with an elevated risk of interloper contamination. It was observed with JWST in Cycle 1 (PID 01827; PI: Kakiichi) using NIRSpec in the IFU mode with the F170LP/G235M filter-grating combination. We downloaded the Level 3 spectral cubes from the Mikulski Archive for the Space Telescopes (MAST). We did not attempt any reduction or cleaning steps beyond what is done by the automated pipeline except for manually aligning and subtracting the background cube. We also obtained archival HST imaging data from the LymAn Continuum Escape Survey (LACES, PID: 14747, PI: Robertson), taken with WFC3/F336W and ACS/F160W. These data are described by Fletcher et al. (2019). For UVIS/F336W, we obtained Hubble Advanced Products Multi-Visit Mosaic products from MAST, which offered a convenient high-quality data product. We obtained the combined ACS/F160W frames from the Hubble Legacy Archive. The world coordinate systems were well aligned in F336W and NIRSpec, but they were somewhat off in F160W. We used a number of compact sources in the field to make sure F160W was aligned to the other observations to within  .
.
3. Analysis and results
3.1. Stellar morphology
LACES 104037 and its surroundings as seen in these observations are shown together in Fig. 1. The Hubble ACS/F160W image shows a galaxy with two bright cores separated by  along the SE-NW direction and an apparent tidal tail protruding from its southeast edge pointing toward another galaxy to the south at the edge of the NIRSpec footprint. The center panel shows that the LyC emission is spatially coincident with the apparent tidal tail, rather than the main star forming clumps in the central regions of the galaxy. The LyC centroid is offset from the midpoint between the two central knots by
  .
.
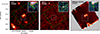 |
Fig. 1. Archival Hubble observations showing LACES104037 and its immediate surroundings in F160W probing the rest-frame B band (left) and in F336W showing rest-frame LyC (center) along with a rest-frame optical continuum image of the JWST/NIRSpec IFS cube (right). Dashed green squares in the HST images show the approximate footprint of the JWST/NIRSpec observations. Insets show a zoom in on LACES104037 itself, centered on the LCE. |
3.2. Emission line mapping
We performed line fits of the emission lines of LACES104037 in each spaxel of the NIRSpec IFU cube following the procedure outlined in Rivera-Thorsen et al. (2025), which we refer to for a more detailed description. In short, we initially subtracted the continuum in each spaxel by masking out the strong emission lines and subsequently took a running median in a 31 pixel window, interpolating this median array onto the masked pixels and subtracting it from the spectrum. We then used the line fitting software CubeFitter.jl (Rivera-Thorsen 2025) to fit the lines Hβ, [O III] λλ4960,5008, Hα, and [N II] λλ6548,6584 to single Gaussian profiles with a shared redshift and line width. At a resolving power of R ∼ 1000, G235M does not resolve the line widths of the relevant lines. In addition to the line fits, we also computed the line fluxes through numerical integration over a window 2000 km s−1 wide centered around the redshift z0 = 3.062, which we selected to cover the full line in both component galaxies. Figure 2 shows the resulting kinematic and line emission maps. Importantly, the fitting shows that the visual companion galaxy to the south of LACES104037 is indeed a physical interacting companion separated from LACES104037 by a projected distance of ∼ 12.5 kpc (approximately 1.5 times the radius of the Milky Way disk) and blueshifted by a relative line-of-sight velocity of ∼ 450 km s−1. We found no designation for this companion in the NASA/Ipac extragalactic database NED, so we designated it LACES104037-S. We also noted a small group of spaxels to the southeast with redshift in between the two major galaxies, possibly representing a third minor interacting party. The right panel in Fig. 2 shows the [O III] λ5008 numerical line flux map. The map shows a faint continuous bridge of ionized gas between LACES104037 and the companion galaxy and significant emission from both. We note that the LyC escape is not coincident with locally elevated emission strength in [O III]. Stars and gas are often separated in tidal features (Hibbard et al. 2000), so (plausibly) the amount of gas in the tidal bridge is small and relatively easy for stellar wind from young stars to have cleared away. If this is a common occurrence in the z ≳ 2 Universe, it could constitute a significant source of ionizing radiation not well accounted for by low-redshift calibrations.
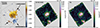 |
Fig. 2. Kinematics and [O III] and Hα line emission in LACES104037 and the companion LACES104037-S. The Redshift is masked to only include spaxels where S/N([O III]) > 3 and the line fitting successfully converged on a solution. This map shows that LACES104037-S is close to LACES104037 in velocity space and most likely an interacting companion. The circle shows the approximate location of the escaping LyC, and the black contours in the redshift map show stellar continuum levels from the right panel in Fig. 1. The question mark in the left panel indicates a faint possible third interacting companion. |
3.3. Ionizing escape fraction and stellar population age
We estimated a local omnidirectional  from the LCE clump by comparing the Hα and LyC flux. We extracted a spectrum from the 2 × 2 IFU spaxels seen in the crosshairs in the right panel of Fig. 1, approximately centered on the LCE; measured the Hα line flux; and used the conversion factor from Kennicutt (1998) to translate this into an ionizing photon flux q(H0). From visual inspection of the NIRSpec IFU PSF1, we found that roughly 40% of the Hα emission in the LCE is contributed by the PSF of the main galaxy, while the aperture loss of a point source in a 2 × 2 aperture is 40%, causing the two effects to approximately cancel each other. We added an estimated 15% uncertainty to the measured F(Hα) to account for these unknowns. We measured the LyC flux in a matching aperture, and we estimated the photometric errors as the standard deviation of 500 randomly placed apertures on empty nearby regions. We converted LyC flux to an ionizing photon flux using the photon energy at 825 Å, assuming that the redshift-corrected central wavelength in F336W is also the average wavelength of LyC photons from this source. We found F(Hα) = (4.7 ± 0.2) × 10−19 erg cm−2 s−1, yielding q(Hα) = (2.7 ± 0.1) × 10−7 cm−2 s−1, and FLyC = (8.7 ± 1.9) × 10−18 erg cm−2 s−1, yielding q(LyC) = (3.62 ± 0.79) × 10−7 cm−2 s−1. Assuming no significant dust extinction and no LyC flux outside the wavelength range of the filter, this led to
  . We also estimated W(Hα) in this spectrum, taking into account the ionizing escape fraction. We found an approximate redshift-corrected and LyC escape-corrected rest-frame W(Hα) ≈ 340 ± 50 Å. When comparing this to instantaneous burst S99 models2 with metallicities between 20% and 200% Z⊙, we consistently found approximate stellar ages of 6 ± 1 Myr across the initial mass function slope and mass cutoff.
3.4. Galaxy interaction timescale
The two interacting galaxies have redshifts of zLACES104037-S ≈ 3.059 and zLACES104037 ≈ 3.065, yielding a relative line-of-sight velocity component between the two galaxies of v‖ = vrel × cos θ ≈ 445 km s−1, where θ is the viewing angle. The transverse physical distance component between the galaxies is d⊥ = d × sin θ ≈ 12.5 kpc. From this, the time since interaction is given as  . We do not know the viewing angle of the relative motion, but reasonable angles of 30 and 60 deg correspond to a time since closest approach of t ≈ 45 and t ≈ 15 Myr. Since the stellar population age is ≲ 6.5 Myr, it is unlikely that the leaking stars already existed at the time of the closest approach. Instead, they most likely formed inside the tidal bridge formed by the interaction.
We have also considered the possibility that the dual cores of LACES104037 might be a sign that the galaxy is itself a late-stage merger and that the tidal tail might instead have originated from this interaction. However, while the separation from LCE to the nearest core is only  , the velocity is v ≲ 80 km s−1, leading to a travel time of t ≈ 34 Myr × (tanθ)−1 Myr, still favoring in situ formation.
4. Summary
In this work, we have found that the LCE candidate galaxy LACES104037 from the work of Fletcher et al. (2019) is interacting with the nearby galaxy LACES103037-S and that the candidate LyC emission reported in that work originates from in situ formed massive stars in a tidal feature toward the companion. We find that LACES104037 differs from typical LCEs at low redshift in that the escaping LyC originates not from the bright and highly star forming core but from an in situ formed star cluster in a tidal bridge toward the companion offset from the center of the galaxy by a projected distance of ≈ 4.8 kpc in a region not associated with elevated nebular line emission. We find traces of a possible third smaller companion system to the southeast of the main companion galaxy, with a redshift intermediate to the two larger galaxies. We find faint but definite extended line emission tendrils and halos surrounding both of the major galaxies, with a marginal overlap between them. Such significant LyC escape from the very outskirts of a galaxy suggests that a (potentially significant) subpopulation of LCE galaxies, particularly at z ≳ 2, might not be well characterized by the z ≲ 0.5 samples typically used to calibrate observational  proxies. Many LCE surveys select against the type of LCE that LACES104037 represents by excluding morphologically complex galaxies and candidates with LyC emission offset from the main nonionizing continuum emission based on an elevated risk that such systems are contaminated by foreground interlopers. Such caution is well founded, as it can be difficult to distinguish morphologically complex systems from interlopers, but works such as this one show that it might also lead to exclusion of a significant number of LCEs and consequently an underestimation of their diversity.
Acknowledgments
This work is based on observations made with the NASA/ESA/CSA James Webb Space Telescope and the NASA/ESA Hubble Space Telescope. The data were obtained from the Mikulski Archive for Space Telescopes at the Space Telescope Science Institute, which is operated by the Association of Universities for Research in Astronomy, Inc., under NASA contract NAS 5-03127 for JWST and NAS 5-26555 for HST. These observations are associated with programs 14747 and 01827. ER-T is supported by the Swedish Research Council grant 2022-04805.
References
- Alavi, A., Colbert, J., Teplitz, H. I., et al. 2020, ApJ, 904, 59 [NASA ADS] [CrossRef] [Google Scholar]
- Alexandroff, R. M., Heckman, T. M., Borthakur, S., Overzier, R., & Leitherer, C. 2015, ApJ, 810, 104 [Google Scholar]
- Amorín, R. O., Rodríguez-Henríquez, M., Fernández, V., et al. 2024, A&A, 682, L25 [NASA ADS] [CrossRef] [EDP Sciences] [Google Scholar]
- Atek, H., Labbé, I., Furtak, L. J., et al. 2024, Nature, 626, 975 [NASA ADS] [CrossRef] [Google Scholar]
- Bassett, R., Ryan-Weber, E. V., Cooke, J., et al. 2022, MNRAS, 511, 5730 [NASA ADS] [CrossRef] [Google Scholar]
- Bergvall, N., Leitet, E., Zackrisson, E., & Marquart, T. 2013, A&A, 554, A38 [NASA ADS] [CrossRef] [EDP Sciences] [Google Scholar]
- Borthakur, S., Heckman, T. M., Leitherer, C., & Overzier, R. A. 2014, Science, 346, 216 [Google Scholar]
- Bridge, C. R., Teplitz, H. I., Siana, B., et al. 2010, ApJ, 720, 465 [NASA ADS] [CrossRef] [Google Scholar]
- Chisholm, J., Orlitová, I., Schaerer, D., et al. 2017, A&A, 605, A67 [NASA ADS] [CrossRef] [EDP Sciences] [Google Scholar]
- Chisholm, J., Gazagnes, S., Schaerer, D., et al. 2018, A&A, 616, A30 [NASA ADS] [CrossRef] [EDP Sciences] [Google Scholar]
- Citro, A., Scarlata, C. M., Mantha, K. B., et al. 2025, ApJ, 986, 184 [Google Scholar]
- Cowie, L. L., Barger, A. J., & Trouille, L. 2009, ApJ, 692, 1476 [NASA ADS] [CrossRef] [Google Scholar]
- Darg, D. W., Kaviraj, S., Lintott, C. J., et al. 2010, MNRAS, 401, 1043 [NASA ADS] [CrossRef] [Google Scholar]
- Davies, F. B., Bosman, S. E. I., Furlanetto, S. R., Becker, G. D., & D’Aloisio, A. 2021, ApJ, 918, L35 [NASA ADS] [CrossRef] [Google Scholar]
- Duan, Q., Conselice, C. J., Li, Q., et al. 2025, MNRAS, 540, 774 [Google Scholar]
- Ejdetjärn, T., Agertz, O., Renaud, F., et al. 2025, MNRAS, 543, 3849 [Google Scholar]
- Faucher-Giguère, C.-A. 2020, MNRAS, 493, 1614 [Google Scholar]
- Finkelstein, S. L., D’Aloisio, A., Paardekooper, J.-P., et al. 2019, ApJ, 879, 36 [Google Scholar]
- Fletcher, T. J., Tang, M., Robertson, B. E., et al. 2019, ApJ, 878, 87 [Google Scholar]
- Flury, S. R., Jaskot, A. E., Ferguson, H. C., et al. 2022a, ApJS, 260, 1 [NASA ADS] [CrossRef] [Google Scholar]
- Flury, S. R., Jaskot, A. E., Ferguson, H. C., et al. 2022b, ApJ, 930, 126 [NASA ADS] [CrossRef] [Google Scholar]
- Flury, S. R., Jaskot, A. E., Saldana-Lopez, A., et al. 2025, ApJ, 985, 128 [Google Scholar]
- Gazagnes, S., Chisholm, J., Schaerer, D., Verhamme, A., & Izotov, Y. 2020, A&A, 639, A85 [NASA ADS] [CrossRef] [EDP Sciences] [Google Scholar]
- Giovinazzo, E., Oesch, P. A., Weibel, A., et al. 2025, A&A, in press, https://doi.org/10.1051/0004-6361/202556204 [Google Scholar]
- Grazian, A., Giallongo, E., Paris, D., et al. 2017, A&A, 602, A18 [NASA ADS] [CrossRef] [EDP Sciences] [Google Scholar]
- Haardt, F., & Madau, P. 2012, ApJ, 746, 125 [Google Scholar]
- Hibbard, J. E., Vacca, W. D., & Yun, M. S. 2000, AJ, 119, 1130 [NASA ADS] [CrossRef] [Google Scholar]
- Izotov, Y. I., Worseck, G., Schaerer, D., et al. 2018, MNRAS, 478, 4851 [Google Scholar]
- Izotov, Y. I., Schaerer, D., Worseck, G., et al. 2025, A&A, 704, A19 [NASA ADS] [CrossRef] [EDP Sciences] [Google Scholar]
- Ji, Z., Giavalisco, M., Vanzella, E., et al. 2020, ApJ, 888, 109 [Google Scholar]
- Kakiichi, K., & Gronke, M. 2021, ApJ, 908, 30 [CrossRef] [Google Scholar]
- Kennicutt, R. C. 1998, ARA&A, 36, 189 [NASA ADS] [CrossRef] [Google Scholar]
- Kerutt, J., Oesch, P. A., Wisotzki, L., et al. 2024, A&A, 684, A42 [NASA ADS] [CrossRef] [EDP Sciences] [Google Scholar]
- Kim, K., Malhotra, S., Rhoads, J. E., Butler, N. R., & Yang, H. 2020, ApJ, 893, 134 [NASA ADS] [CrossRef] [Google Scholar]
- Komarova, L., Oey, M. S., Hernandez, S., et al. 2024, ApJ, 967, 117 [Google Scholar]
- Kostyuk, I., & Ciardi, B. 2025, A&A, 702, A226 [NASA ADS] [CrossRef] [EDP Sciences] [Google Scholar]
- Le Reste, A., Cannon, J. M., Hayes, M. J., et al. 2024, MNRAS, 528, 757 [NASA ADS] [CrossRef] [Google Scholar]
- Le Reste, A., Jaskot, A. E., Brazie, J., et al. 2026, ApJ, 998, 222 [Google Scholar]
- Mainali, R., Rigby, J. R., Chisholm, J., et al. 2022, ApJ, 940, 160 [NASA ADS] [CrossRef] [Google Scholar]
- Malkan, M. A., & Malkan, B. K. 2021, ApJ, 909, 92 [NASA ADS] [CrossRef] [Google Scholar]
- Mascia, S., Pentericci, L., Llerena, M., et al. 2025, A&A, 701, A122 [NASA ADS] [CrossRef] [EDP Sciences] [Google Scholar]
- Naidu, R. P., Tacchella, S., Mason, C. A., et al. 2020, ApJ, 892, 109 [NASA ADS] [CrossRef] [Google Scholar]
- Puschnig, J., Hayes, M., Östlin, G., et al. 2017, MNRAS, 469, 3252 [Google Scholar]
- Puskás, D., Tacchella, S., Simmonds, C., et al. 2025, MNRAS, 540, 2146 [Google Scholar]
- Rivera-Thorsen, T. 2025, https://doi.org/10.5281/zenodo.15919371 [Google Scholar]
- Rivera-Thorsen, T. E., Hayes, M., & Melinder, J. 2022, A&A, 666, A145 [NASA ADS] [CrossRef] [EDP Sciences] [Google Scholar]
- Rivera-Thorsen, T. E., Welch, B., Hutchison, T., et al. 2025, ApJ, submitted [arXiv:2510.11702] [Google Scholar]
- Robertson, B. E., Ellis, R. S., Furlanetto, S. R., & Dunlop, J. S. 2015, ApJ, 802, L19 [Google Scholar]
- Rutkowski, M. J., Scarlata, C., Haardt, F., et al. 2016, ApJ, 819, 81 [NASA ADS] [CrossRef] [Google Scholar]
- Saldana-Lopez, A., Schaerer, D., Chisholm, J., et al. 2022, A&A, 663, A59 [NASA ADS] [CrossRef] [EDP Sciences] [Google Scholar]
- Saxena, A., Pentericci, L., Ellis, R. S., et al. 2022, MNRAS, 511, 120 [NASA ADS] [CrossRef] [Google Scholar]
- Trebitsch, M., Blaizot, J., Rosdahl, J., Devriendt, J., & Slyz, A. 2017, MNRAS, 470, 224 [Google Scholar]
- Wise, J. H. 2019, Contemp. Phys., 60, 145 [NASA ADS] [CrossRef] [Google Scholar]
- Yuan, F.-T., Zheng, Z.-Y., Jiang, C., et al. 2024, ApJ, 975, 53 [Google Scholar]
- Zhu, S., Zheng, Z.-Y., Yuan, F.-T., Jiang, C., & Lin, R. 2025, ApJ, 982, L58 [Google Scholar]
We used stpsf: https://stpsf.readthedocs.io
All Figures
|
Fig. 1. Archival Hubble observations showing LACES104037 and its immediate surroundings in F160W probing the rest-frame B band (left) and in F336W showing rest-frame LyC (center) along with a rest-frame optical continuum image of the JWST/NIRSpec IFS cube (right). Dashed green squares in the HST images show the approximate footprint of the JWST/NIRSpec observations. Insets show a zoom in on LACES104037 itself, centered on the LCE. |
| In the text | |
|
Fig. 2. Kinematics and [O III] and Hα line emission in LACES104037 and the companion LACES104037-S. The Redshift is masked to only include spaxels where S/N([O III]) > 3 and the line fitting successfully converged on a solution. This map shows that LACES104037-S is close to LACES104037 in velocity space and most likely an interacting companion. The circle shows the approximate location of the escaping LyC, and the black contours in the redshift map show stellar continuum levels from the right panel in Fig. 1. The question mark in the left panel indicates a faint possible third interacting companion. |
| In the text | |
Current usage metrics show cumulative count of Article Views (full-text article views including HTML views, PDF and ePub downloads, according to the available data) and Abstracts Views on Vision4Press platform.
Data correspond to usage on the plateform after 2015. The current usage metrics is available 48-96 hours after online publication and is updated daily on week days.
Initial download of the metrics may take a while.