Open Access
Fig. 1
Download original image
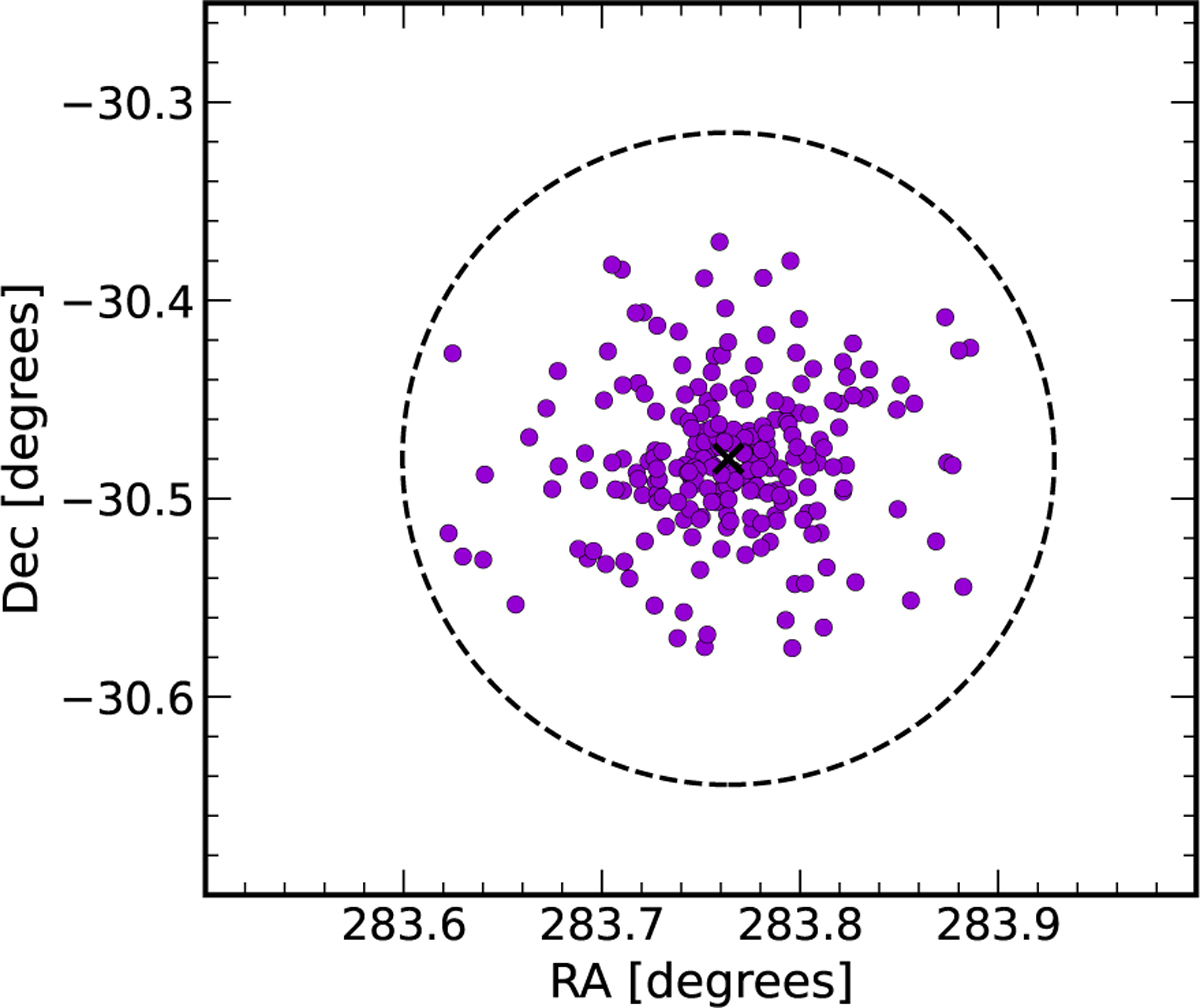
Coordinate positions of the observed targets, displayed with purple circles. The black cross denotes the cluster center (Baumgardt & Hilker 2018). The dashed black circle displays the tidal radius (Harris 2010).
Current usage metrics show cumulative count of Article Views (full-text article views including HTML views, PDF and ePub downloads, according to the available data) and Abstracts Views on Vision4Press platform.
Data correspond to usage on the plateform after 2015. The current usage metrics is available 48-96 hours after online publication and is updated daily on week days.
Initial download of the metrics may take a while.