Fig. 11
Download original image
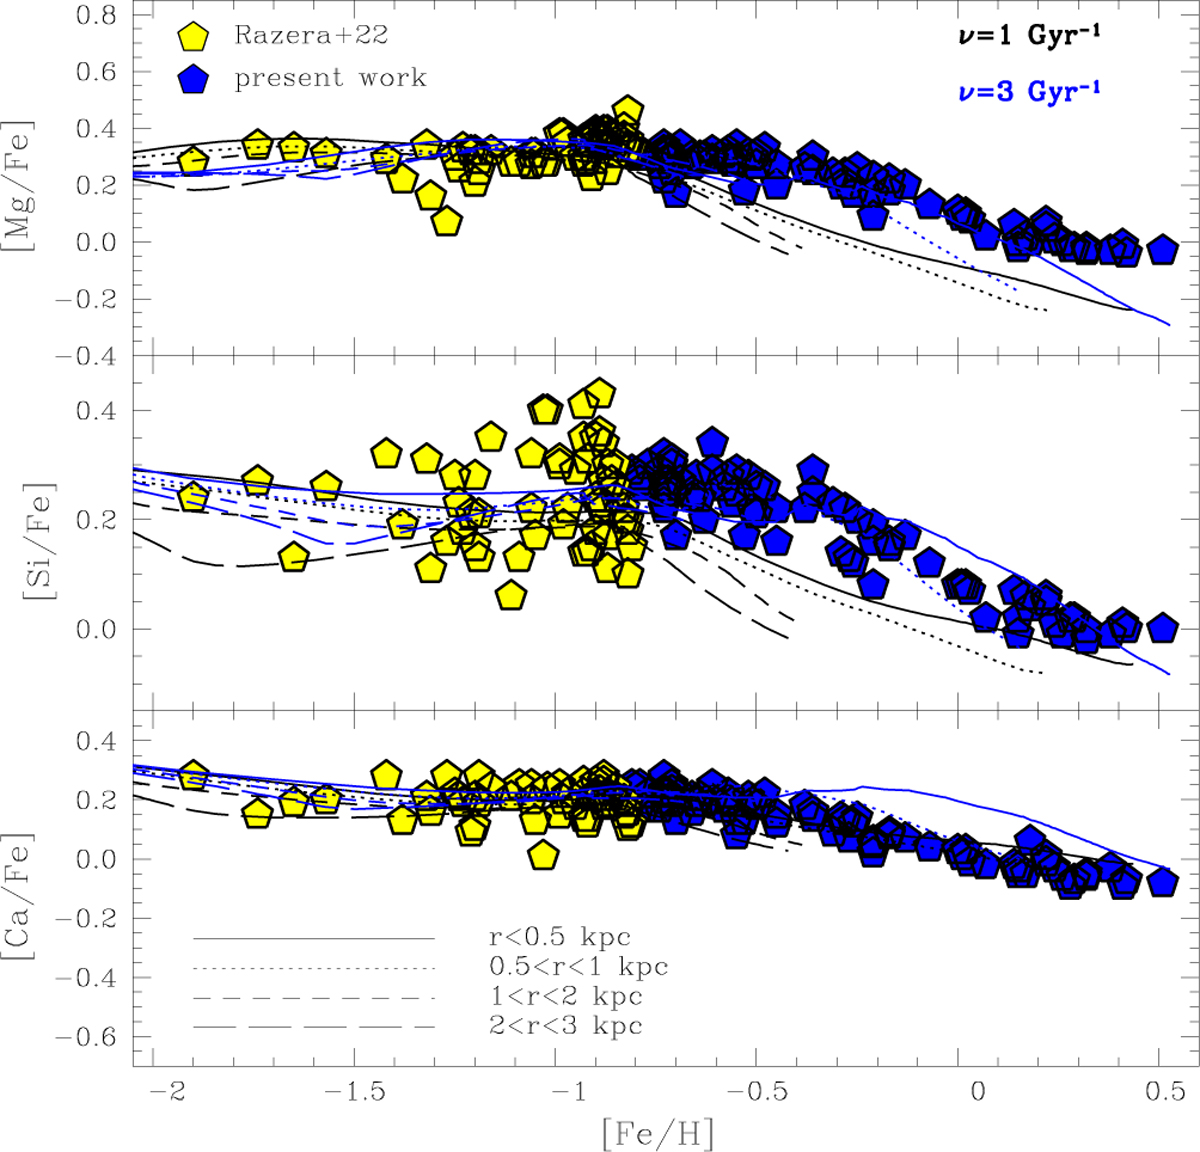
[Mg,Si,Ca/Fe] versus [Fe/H] for bulge spheroid stars. Filled blue pentagons show the ASPCAP results for the present sample; filled yellow pentagons the ASPCAP results for the sample described in Razera et al. (2022). For the chemical-evolution models, different model lines correspond to the outputs of models computed for radii of r < 0.5, 0.5 < r < 1, 1 < r < 2, and 2 < r < 3 kpc from the Galactic centre. Black lines correspond to specific star formation of ν =1 Gyr−1, and blue lines refer to ν =3 Gyr−1.
Current usage metrics show cumulative count of Article Views (full-text article views including HTML views, PDF and ePub downloads, according to the available data) and Abstracts Views on Vision4Press platform.
Data correspond to usage on the plateform after 2015. The current usage metrics is available 48-96 hours after online publication and is updated daily on week days.
Initial download of the metrics may take a while.